Combating Nutritional Dilution: Science-Backed Strategies for Nutrient-Dense Crops in Modern Agriculture
This article addresses the critical challenge of nutritional dilution, the declining concentration of vitamins, minerals, and proteins in modern crops driven by soil degradation, climate change, and intensive farming practices.
Combating Nutritional Dilution: Science-Backed Strategies for Nutrient-Dense Crops in Modern Agriculture
Abstract
This article addresses the critical challenge of nutritional dilution, the declining concentration of vitamins, minerals, and proteins in modern crops driven by soil degradation, climate change, and intensive farming practices. Tailored for researchers, scientists, and drug development professionals, it synthesizes the latest interdisciplinary research to explore the biochemical mechanisms behind nutrient loss, evaluate emerging remediation strategies—from advanced breeding to precision agronomy—and discuss the implications for clinical research and public health. The content provides a foundational understanding, practical methodologies, troubleshooting for implementation, and a comparative validation of approaches to build resilient, nutrient-secure food systems.
The Silent Crisis: Understanding the Causes and Scale of Nutrient Decline in Our Food
Frequently Asked Questions (FAQs)
Q1: What is nutritional dilution, and why is it a significant concern in modern agriculture? Nutritional dilution refers to the decline in the concentration of essential nutrients, such as vitamins and minerals, in edible parts of crops. This phenomenon is a significant concern because it can lead to reduced dietary nutritional value, potentially contributing to hidden hunger and impacting human health, even when caloric intake is sufficient [1].
Q2: How does climate change exacerbate the problem of nutritional dilution? Climate change disrupts agricultural nutrient dynamics through increased temperatures, altered precipitation patterns, and extreme weather events. These changes can alter soil nutrient cycles, microbial activity, and crop physiology. For instance, elevated CO2 levels can reduce grain quality, while erratic rainfall increases nutrient losses through leaching and runoff, worsening nutritional dilution [1].
Q3: What are the limitations of conventional fertilizer practices in addressing nutritional dilution? Conventional practices often rely on excessive chemical fertilizer use, which contributes to nutrient losses, soil degradation, and greenhouse gas emissions. These methods are inefficient; for example, only 30–40% of applied nitrogen is typically utilized by the crop, with the rest lost to the environment, failing to ensure nutrients are effectively translated into the harvested crop [1].
Q4: Which emerging nutrient management strategies are most effective for reducing nutritional dilution? Integrated Nutrient Management (INM), which combines organic and inorganic sources, and precision agriculture techniques like Site-Specific Nutrient Management (SSNM) are highly effective. These strategies improve nutrient use efficiency (NUE), enhance soil health, and can increase crop yields by 8–150% compared to conventional practices, thereby countering dilution [1].
Q5: How can researchers accurately diagnose and monitor nutritional dilution in field experiments? Diagnosis requires monitoring soil nutrient availability, plant nutrient uptake, and the final nutrient concentration in the harvested yield. Methodologies include soil and plant tissue sampling, using decision support systems for nutrient management planning, and employing precision agriculture tools to assess spatial and temporal variability in nutrient levels [1].
Experimental Protocols for Mitigating Nutritional Dilution
Protocol 1: Evaluating Integrated Nutrient Management (INM)
Objective: To assess the impact of combined organic and inorganic fertilizers on crop nutritional quality and yield.
- Experimental Design: Establish a randomized complete block design with a minimum of four treatments replicated three times.
- Treatment Application:
- T1: Control (No fertilizer).
- T2: 100% recommended dose of NPK chemical fertilizers.
- T3: 75% recommended NPK + 10 t ha⁻¹ Farmyard Manure (FYM).
- T4: 75% recommended NPK + 10 t ha⁻¹ FYM + Bioinoculants.
- Data Collection:
- Soil Analysis: Pre-sowing and post-harvest analysis of soil for major nutrients (N, P, K), organic carbon, and microbial activity.
- Plant Tissue Analysis: Sample plant tissue at critical growth stages to measure nutrient uptake.
- Yield and Quality Analysis: At harvest, measure grain and straw yield. Analyze grain for protein content and micronutrient concentrations (e.g., Zn, Fe).
- Statistical Analysis: Analyze data using ANOVA, and compare treatment means with appropriate post-hoc tests (e.g., Tukey's HSD) at a 5% significance level [1].
Protocol 2: Implementing Site-Specific Nutrient Management (SSNM)
Objective: To optimize nutrient application based on localized field requirements to enhance Nutrient Use Efficiency (NUE) and reduce losses.
- Field Characterization: Divide the experimental field into management zones based on soil test results, crop yield history, and topography.
- Sensor-Based Assessment: Use soil sensors or remote sensing (e.g., NDVI from drones) to assess spatial variability in soil fertility and crop nitrogen status during the growing season.
- Variable-Rate Application: Apply fertilizers using variable-rate technology, tailoring the rate of N, P, and K to the needs of each specific management zone. Banding application of phosphorus is often more efficient than broadcasting [1].
- Validation: Compare the SSNM approach with a uniform application practice, measuring differences in yield, nutrient concentration in grains, and post-harvest soil nutrient levels to calculate NUE and apparent nutrient recovery.
The following table summarizes quantitative data on the performance of various nutrient management strategies in mitigating nutritional dilution and improving sustainability.
Table 1: Comparison of Nutrient Management Strategies and Their Impacts
| Strategy | Key Performance Metrics | Impact on Nutritional Dilution & Sustainability | Implementation Considerations |
|---|---|---|---|
| Integrated Nutrient Management (INM) [1] | Yield increase of 8% to 150%; improved soil organic carbon. | Reduces reliance on chemical fertilizers; enhances nutrient availability and grain quality. | Requires access to quality organic amendments; management is more complex. |
| Precision Agriculture & SSNM [1] | Can significantly improve Nutrient Use Efficiency (NUE); reduces fertilizer losses. | Ensures optimal nutrient availability during critical growth stages, improving nutrient content in grains. | High initial investment in technology and skills for data interpretation. |
| Conservation Agriculture [1] | Enhances soil moisture retention; improves soil structure. | Builds soil health and resilience, creating a more stable environment for nutrient uptake. | Requires changes to traditional tillage practices; weed management can be challenging. |
| 4R Nutrient Stewardship [1] | Aims to increase Fertilizer Utilization Efficiency (FUE). | Minimizes nutrient losses to the environment, making more nutrients available for the crop. | Involves careful planning for right source, rate, time, and place of application. |
| Biofertilizers & Biostimulants [1] | Reduces chemical N fertilizer requirement; promotes soil microbial activity. | Improves plant nutrient acquisition, potentially increasing nutrient density. | Effectiveness can be dependent on specific soil and environmental conditions. |
The Scientist's Toolkit: Research Reagent Solutions
Table 2: Essential Reagents and Materials for Nutritional Dilution Research
| Item | Function/Application in Research |
|---|---|
| Soil Test Kits (N, P, K, pH) | For initial and ongoing assessment of soil nutrient status and acidity, which forms the basis for fertilizer recommendations. |
| Plant Tissue Digestation Reagents (e.g., HNO₃, H₂O₂) | Used in microwave-assisted digestion to prepare plant tissue samples for elemental analysis. |
| Inductively Coupled Plasma (ICP) Standards | Certified reference materials for calibrating ICP-OES or ICP-MS instruments to accurately quantify micronutrients (e.g., Zn, Fe) in plant digests. |
| Bioinoculants (e.g., Rhizobium, Azotobacter, Mycorrhizae) | Microbial formulations used as treatments to enhance biological nitrogen fixation and improve phosphorus solubility and uptake by plants. |
| Controlled-Release Fertilizer Coatings (e.g., polymer-coated urea) | Materials studied to create fertilizers that release nutrients in sync with crop demand, improving NUE and reducing losses. |
| Farmyard Manure (FYM) / Compost | Standardized organic amendment used in INM studies to improve soil structure, water-holding capacity, and slow-release nutrient supply. |
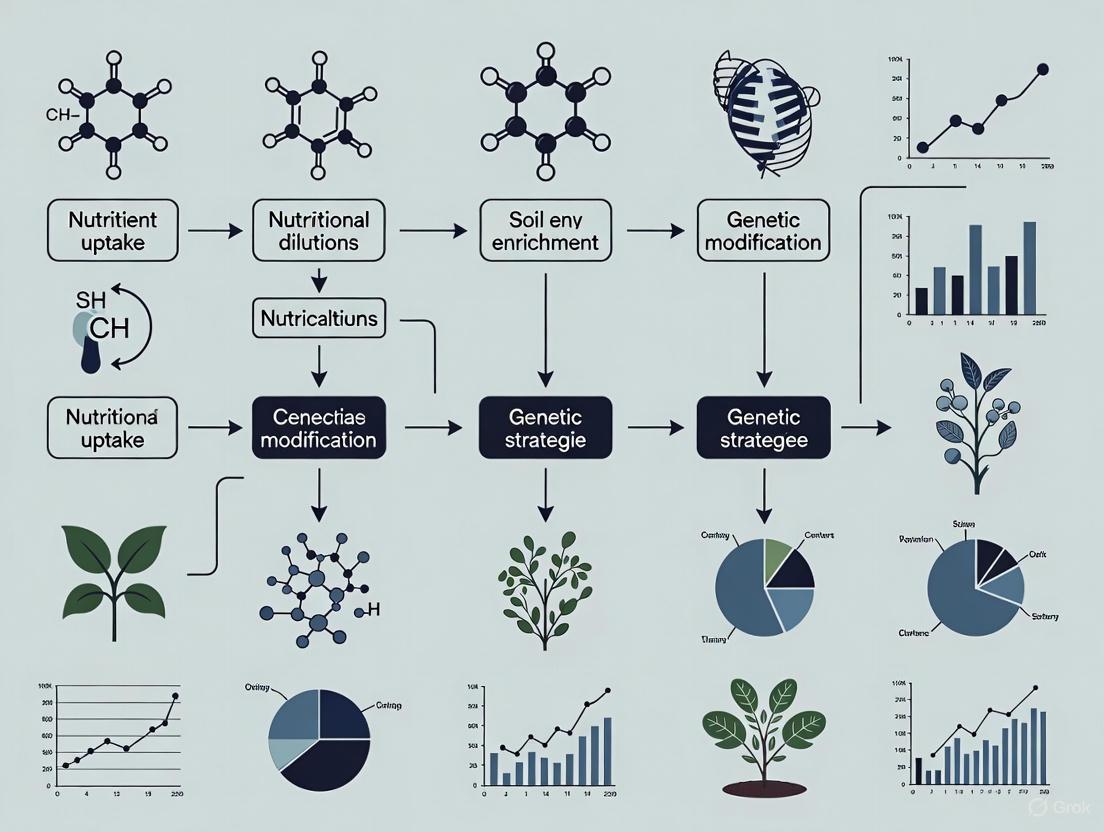
Research Workflow and Conceptual Diagrams
Experimental Workflow for Nutritional Dilution Research
This diagram outlines a generalized workflow for conducting experiments aimed at mitigating nutritional dilution in crops.
Integrated Nutrient Management (INM) Concept
This diagram illustrates the components and benefits of an Integrated Nutrient Management strategy.
FAQs: Understanding the Problem
What is "nutrient dilution" in the context of food crops? Nutrient dilution, or Nutrient Dilution Food Quality, refers to the observed decline in the concentration of essential vitamins and minerals in many common food crops over the past several decades [2]. This phenomenon means that for the same amount of food, we are getting fewer nutrients than previous generations did.
What is the primary cause of mineral depletion in modern crops? The decline is attributed to a combination of factors, primarily modern agricultural practices that prioritize high yield volume over nutritional density [2] [3]. This includes chaotic mineral nutrient application, the use of high-yielding varieties that allocate nutrients differently, and agronomic issues associated with a shift from natural to chemical farming, which disrupts soil biological activity [3].
How significant is the decline in mineral content? Research shows a dramatic and alarming decline. The table below summarizes key findings on the reduction of mineral content in fruits and vegetables over various periods in the last century [3].
Table: Documented Declines in Mineral Content of Fruits and Vegetables
| Mineral | Time Period | Documented Decline | Specific Examples |
|---|---|---|---|
| Calcium (Ca) | 1975-1997 | Up to 46% | Lemons (-57.4%), Pineapples (-58.8%), Tangerines (-65%) [3]. |
| Iron (Fe) | 1940-1991 | 24% to 50% | Bananas (-55.7%), Oranges (-75%), Watercress (-88.2%) [3]. |
| Magnesium (Mg) | 1936-1991 | 10% to 35% | Consistent decrease in vegetables and wheat [3] [4]. |
| Copper (Cu) | 1940-1991 | 49% to 81% | Dramatic absolute and relative reductions [3]. |
| Zinc (Zn) | 1978-1991 | 27% to 59% | Noted across a range of vegetable crops [3]. |
| Vitamin A | 1975-1997 | Up to 38% | Cauliflower (-68.3%), Broccoli (-38.3%) [3]. |
How does soil health directly impact the nutritional quality of a crop? Soil is not an inert growing medium but a vital living ecosystem [5]. Healthy soil, teeming with diverse microbes like bacteria and fungi, is the foundation for nutrient cycling. These organisms help break down organic matter and make minerals available for plant uptake. Degraded soil with low biological activity cannot effectively support this process, leading to plants with lower nutrient density [5] [6].
What are the key soil functions that support nutritious crops? According to the USDA NRCS, healthy soil performs five essential functions that are critical for producing nutrient-dense crops [5]:
- Cycling nutrients: Carbon, nitrogen, phosphorus, and other nutrients are stored, transformed, and cycled.
- Sustaining plant and animal life: The diversity and productivity of living things depend on soil.
- Regulating water: Soil controls the flow and infiltration of water.
- Filtering and buffering potential pollutants: Minerals and microbes degrade and detoxify materials.
- Providing physical stability and support: Soil structure provides a medium for plant roots.
Troubleshooting Guides & Experimental Protocols
Guide 1: Diagnosing Soil Health and Nutrient Availability
This guide provides a methodology for assessing whether your experimental or field site has soil conditions that predispose crops to nutrient dilution.
Table: Soil Health Assessment Parameters and Methods
| Parameter to Assess | Signs of a Healthy System | Warning Signs of Degradation | Recommended Assessment Method |
|---|---|---|---|
| Soil Organic Matter | High levels; dark, crumbly structure. | Low levels; poor structure, compaction. | Loss-on-Ignition (LOI) Test: Measure soil weight loss after combustion at high temperatures to estimate organic matter content [5]. |
| Microbial Activity | Diverse and abundant microbial populations. | Low microbial biomass and diversity. | Soil Respiration Test: Measure CO2 flux from a soil sample as an indicator of microbial metabolic activity [5]. |
| Soil Structure & Infiltration | Stable aggregates, high water infiltration. | Crusting, compaction, high runoff. | Slake Test: Immerse an air-dried soil aggregate in water to observe its stability. Infiltration Ring Test: Measure the rate of water entry into the soil [5]. |
| Plant Nutrient Status | Optimal tissue concentrations of minerals. | Nutrient deficiency symptoms (e.g., chlorosis). | Plant Tissue Analysis: Laboratory analysis of specific crop tissues for nutrient concentrations to compare against established sufficiency ranges [7]. |
Experimental Protocol: Comparing Soil Health Management Systems Objective: To quantify the effect of different soil management practices on soil health indicators and crop mineral density.
- Site Selection & Plot Design: Establish replicated plots in a uniform field.
- Treatment Application:
- Treatment A (Conventional): Tillage, synthetic fertilizers, monoculture.
- Treatment B (Regenerative): No-till, diverse cover crop mixes, compost application, diversified rotations [5].
- Soil Sampling: Collect soil samples from each plot at 0-15 cm depth at the beginning and end of the growing season. Analyze for soil organic matter, microbial biomass (e.g., via phospholipid fatty acid analysis), and available nutrient levels (e.g., Mehlich-3 or DTPA extraction).
- Plant Sampling: At harvest, collect crop samples from each plot. Prepare tissue samples for laboratory analysis of target minerals (e.g., Fe, Zn, Mg, Ca) using ICP-MS or similar techniques.
- Data Analysis: Perform ANOVA to determine if differences in soil parameters and crop mineral content between treatments are statistically significant.
The logical relationship between management practices, soil health, and crop nutrition is outlined below.
Guide 2: Addressing Nutrient Dilution in Experimental Crops
This guide provides actionable strategies for researchers to counter nutrient dilution in their agricultural studies.
Strategy 1: Enhance Soil Biological Activity
- Principle: Feed the soil microbiome to improve nutrient cycling [5].
- Protocol: Incorporate a multi-species cover crop mix (e.g., legumes, grasses, and brassicas) into the crop rotation. Terminate the cover crop and allow it to decompose as a green manure. Compare crop nutrient uptake and yield in these plots against fallow controls [5].
- Troubleshooting: If biomass is low, ensure adequate soil moisture during the cover crop growth period. Test different cover crop species mixtures to find the optimal combination for your soil type and climate.
Strategy 2: Utilize Cultivars with High Nutrient-Use Efficiency
- Principle: Genetic variation exists in the ability of crops to uptake and translocate minerals [3].
- Protocol: Screen different cultivars or landraces of the same crop under identical field conditions. Measure the concentration of target minerals in the edible parts. Select breeding lines that consistently show higher nutrient density without significant yield penalty [3].
- Troubleshooting: High nutrient density may be linked to smaller seed or fruit size. Focus breeding efforts on breaking this negative correlation.
Strategy 3: Re-mineralize Soils with Balanced Amendments
- Principle: Replenish the full spectrum of macro and micronutrients depleted by intensive farming [4].
- Protocol: Conduct a detailed soil test to identify specific mineral deficiencies. Apply soil amendments such as rock dust (for trace minerals), gypsum (for calcium and sulfur), or compost to address imbalances. Monitor soil test levels and plant tissue concentrations over multiple seasons.
- Troubleshooting: Be aware of nutrient antagonisms (e.g., high phosphorus can inhibit zinc uptake). Apply amendments based on soil test recommendations to avoid creating new imbalances.
The workflow for developing a nutrient-dense cropping system integrates these strategies.
The Scientist's Toolkit: Research Reagent Solutions
Table: Essential Materials and Reagents for Soil Health and Crop Nutrition Research
| Item / Reagent | Function / Application in Research |
|---|---|
| ICP-MS (Inductively Coupled Plasma Mass Spectrometry) | High-sensitivity analytical instrument for precise quantification of multiple mineral elements (e.g., Fe, Zn, Se, Ca) in plant tissue and soil extracts [3]. |
| PLFA (Phospholipid Fatty Acid) Analysis | A biochemical technique used to profile the structure and mass of the soil microbial community, serving as an indicator of soil biological health [5]. |
| Mycorrhizal Fungi Inoculant | Beneficial soil fungi that form symbiotic relationships with plant roots, significantly enhancing the plant's ability to forage for phosphorus and other immobile nutrients [6]. |
| Multi-Species Cover Crop Seed Mix | A living reagent used to maximize biodiversity. Legumes fix nitrogen, grasses build soil organic matter, and deep-rooted brassicas mine minerals from the subsoil [5]. |
| Soil Respiration Chambers | Portable field equipment used to measure CO2 flux from the soil surface, which is a direct indicator of microbial metabolic activity and soil organic matter decomposition [5]. |
| DTPA (Diethylenetriaminepentaacetic acid) Extractant | A common chemical extractant used to simulate plant uptake and estimate the bioavailable fraction of micronutrients like zinc, iron, copper, and manganese in soil [7]. |
| Biochar | A carbon-rich soil amendment produced from pyrolyzed organic biomass. It can improve soil fertility, water retention, and microbial habitat, potentially increasing nutrient availability to plants [8]. |
Troubleshooting Guides and FAQs
Frequently Asked Questions
Q1: In my experiments with elevated CO₂, I am observing a decline in plant nutritional quality despite increased biomass. What are the primary biochemical mechanisms behind this, and how can I mitigate it in a research setting?
A1: The decline in nutritional quality, often termed "nutritional dilution," under elevated CO₂ is primarily driven by two key mechanisms:
- Carbohydrate Accumulation: Elevated CO₂ significantly enhances the net photosynthetic rate (Aₙₑₜ), leading to a greater production of carbohydrates (e.g., total soluble sugars and starch) [9]. This increase in carbon-rich compounds can dilute the concentration of other essential nutrients, such as proteins and minerals, in plant tissues [10].
- Reduced Nitrogen Assimilation: A critical factor is the down-regulation of photosynthetic capacity and the impairment of the carboxylation process often observed under high CO₂, which can be linked to a reduction in nitrogen uptake and assimilation [10] [11]. This results in a wider carbon-to-nitrogen (C:N) ratio in plant tissues [9]. Hormonal shifts, particularly a reduction in growth-promoting hormones like cytokinins which are vital for nitrogen metabolism, can further exacerbate this issue under combined stress [11].
Mitigation Strategies for Researchers:
- Nutrient Management: Implement a split-application of nitrogen fertilizers timed to coincide with peak crop demand. This helps ensure nitrogen availability matches the plant's enhanced growth under eCO₂, preventing dilution [12].
- Genotype Selection: Screen and select plant varieties that maintain robust nitrogen assimilation and photosynthetic machinery under eCO₂ conditions. For instance, some maize hybrids like DHM117 show better physiological recovery under combined eCO₂ and temperature stress, which can be linked to better resource allocation [9].
Q2: High night temperature (HNT) stress is causing significant yield loss in my grain crops. What are the specific physiological disruptions, and what experimental parameters should I monitor to identify tolerant lines?
A2: HNT stress primarily induces a carbon deficit and disrupts reproductive processes.
- Carbon Deficit: HNT increases dark respiration rates, leading to excessive consumption of photosynthetic products (carbohydrates) that were accumulated during the day. This results in a net loss of carbon reserves essential for growth and grain filling [11]. Monitoring non-structural carbohydrates (starch and sugars) in leaves and stems can quantify this loss.
- Reproductive Disruption: HNT during critical stages like grain number determination or anthesis silking interval (ASI) can cause spikelet sterility and reduce seed set [11] [9]. This is often linked to inhibition of pollen tube elongation and disruption of auxin homeostasis in pollinated pistils [11].
Key Experimental Parameters to Monitor:
- Phenology: Precisely record the Anthesis Silking Interval (ASI); a widening interval is a key indicator of heat stress in cereals like maize [9].
- Physiology: Measure leaf photosynthetic rate (Aₙₑₜ) and dark respiration rate throughout the growth cycle [11] [9].
- Stress Markers: Quantify biochemical stress markers like malondialdehyde (MDA) for lipid peroxidation and proline for osmotic adjustment. Elevated CO₂ has been shown to mitigate MDA accumulation under high temperature stress [9].
- Yield Components: Conduct detailed analyses of biomass allocation (root vs. shoot), grain yield, and harvest index [10] [9].
Q3: I am observing conflicting interactions between elevated CO₂ and elevated temperature in my C4 plant studies. How can I reconcile these responses in my experimental design and data interpretation?
A3: The interaction between elevated CO₂ (eCO₂) and elevated temperature (eT) is complex and can be antagonistic or synergistic, depending on the plant process being observed. Your experimental design should therefore treat them as independent variables.
- Ameliorating Effect: eCO₂ can partially mitigate the negative impacts of eT. For example, eT often impairs stomatal conductance and the carboxylation capacity of Rubisco, but eCO₂ can help revert this impact by improving water use efficiency and protecting photochemical processes [10] [9]. This is evident in the restoration of photosynthetic rates and reduction of oxidative damage markers like MDA [9].
- Non-Linear Interactions: In some cases, the combination of eT + eCO₂ can lead to unique outcomes not seen with either factor alone. For instance, one study on Dianthus inoxianus found that while eT alone hastened flowering and eCO₂ alone induced photosynthetic acclimation, the combination reduced both leaf-level assimilation and flower production [10].
Guidance for Experimental Design:
- Always include a full factorial design with four core treatments: Ambient CO₂ & Temperature, Ambient CO₂ & Elevated Temperature, Elevated CO₂ & Ambient Temperature, and Elevated CO₂ & Elevated Temperature.
- Focus interpretation on the significance of the interaction term in your statistical models, rather than just main effects. This allows you to formally test whether the effect of temperature depends on the CO₂ level, and vice versa.
Troubleshooting Common Experimental Challenges
Challenge: High variability in plant physiological responses to controlled climate treatments.
- Solution: Ensure rigorous monitoring of chamber conditions. Use soil and plant tissue testing to track nutrient status throughout the experiment, as pre-existing nutrient levels can dramatically influence results [12]. For HNT studies, maintain precise control over the entire 24-hour diurnal cycle, as even short-term fluctuations can trigger respiratory bursts [11].
Challenge: Differentiating between heat avoidance and heat tolerance mechanisms in phenotyping.
- Solution: A plant may complete its life cycle early (avoidance) rather than truly tolerating the stress. To differentiate, measure a suite of traits:
- For Avoidance: Track phenology (days to flowering) and biomass allocation (e.g., increased root-to-shoot ratio) [10].
- For Tolerance: Measure real-time physiological performance (photosynthesis, stomatal conductance) and cellular integrity (membrane stability via electrolyte leakage, MDA content) under sustained stress [13] [9].
Quantitative Data Synthesis
Table 1: Biochemical and Yield Responses to Elevated CO₂ and Temperature
| Stress Factor | Impact on Photosynthesis | Impact on Respiration | Key Biochemical Changes | Typical Impact on Yield | Citation |
|---|---|---|---|---|---|
| Elevated CO₂ (eCO₂) | Increases net photosynthesis (Aₙₑₜ) in C3 plants; can lead to acclimation in some species. | Can be variable; may increase with greater biomass. | ↑ Total Soluble Sugars, ↑ Starch, Wider C/N ratio, ↓ Specific Nitrogen Content | Increase in C3 crops (up to 18-41%); modest increase (5-10%) in C4 crops. | [10] [9] |
| Elevated Temperature (eT) | Impairs photosynthesis; damages PSII, disrupts thylakoid membranes. | Significant increase in dark respiration, especially at night. | ↑ Proline, ↑ MDA (oxidative stress), ↓ Total phenolics, Altered hormone balance (↓ Cytokinins, ↑ ABA) | Decrease; e.g., maize yield reduced by ~8% per 2°C rise. | [13] [11] [9] |
| High Night Temperature (HNT) | Inhibits carbon fixation capacity via accelerated senescence. | Markedly increases, causing carbon deficit. | Depletion of non-structural carbohydrates, Accumulation of stress-protective amino acids. | Significant loss due to reduced grain set and size. | [11] |
| eCO₂ + eT | Can mitigate the negative impact of eT on photosynthesis to some extent. | Interaction effect is complex and species-specific. | eCO₂ can ameliorate eT-induced proline and MDA increases. | eCO₂ can partially offset eT-induced yield losses. | [9] |
Table 2: Essential Research Reagent Solutions for Stress Physiology Studies
| Research Reagent / Kit | Primary Function in Experiment | Example Application in Climate Stress Studies |
|---|---|---|
| Li-Cor Photosynthesis System | Measures leaf gas exchange parameters (Aₙₑₜ, gₛ, Cᵢ). | Quantifying photosynthetic acclimation to eCO₂ and impairment by eT. |
| Chlorophyll Fluorescence Imager | Assesses PSII efficiency (Fᵥ/Fₘ), photoinhibition, and non-photochemical quenching (NPQ). | Evaluating heat damage to photosynthetic apparatus and photoprotective capacity. |
| MDA (Malondialdehyde) Assay Kit | Quantifies lipid peroxidation, a key marker of oxidative stress. | Measuring the severity of membrane damage under HNT and the mitigating effect of eCO₂. |
| Proline Assay Kit | Measures proline accumulation, involved in osmotic adjustment and stress protection. | Assessing osmotic stress response in plants under combined eT and water deficit. |
| ELISA for Phytohormones | Quantifies levels of hormones (ABA, Salicylic Acid, Cytokinins). | Profiling hormonal shifts (e.g., drop in cytokinins) under HNT stress. |
| Soil & Plant Tissue Testing Kits | Determines nutrient content (N, P, K) in soil and plant tissue. | Monitoring nutrient uptake and C/N ratio to study nutritional dilution under eCO₂. |
Experimental Protocols for Key Assays
Protocol 1: Quantifying Oxidative Stress via Malondialdehyde (MDA) Content
- Principle: MDA, a product of lipid peroxidation, reacts with thiobarbituric acid (TBA) to form a colored complex that can be quantified spectrophotometrically.
- Procedure:
- Homogenize 0.5 g of fresh leaf tissue in 5 mL of 0.1% trichloroacetic acid (TCA) on ice.
- Centrifuge the homogenate at 10,000 × g for 10 minutes at 4°C.
- Transfer 1 mL of the supernatant to a new tube and add 4 mL of a solution containing 20% TCA and 0.5% TBA.
- Incubate the mixture in a boiling water bath for 30 minutes, then quickly cool on ice.
- Centrifuge again to clarify and measure the absorbance of the supernatant at 532 nm and 600 nm (for background correction).
- Calculate MDA concentration using its extinction coefficient (155 mM⁻¹cm⁻¹) [9].
Protocol 2: Assessing Photosynthetic Acclimation via CO₂ Response Curves (A/Cᵢ)
- Principle: A/Cᵢ curves describe the relationship between net CO₂ assimilation rate (A) and intercellular CO₂ concentration (Cᵢ), allowing for the determination of key photosynthetic parameters like maximum carboxylation capacity (Vcₘₐₓ) and maximum electron transport rate (Jₘₐₓ).
- Procedure:
- Using an infrared gas analyzer (IRGA) system, stabilize a attached leaf under controlled light and temperature conditions.
- Measure Aₙₑₜ at a series of decreasing CO₂ concentrations (e.g., from 400 ppm down to 50 ppm) to capture the Rubisco-limited region.
- Subsequently, measure Aₙₑₜ at a series of increasing CO₂ concentrations (e.g., from 400 ppm up to 1500 ppm) to capture the RuBP regeneration-limited region.
- Fit the data to a biochemical model of photosynthesis (e.g., the Farquhar-von Caemmerer-Berry model) to extract Vcₘₐₓ and Jₘₐₓ. A decline in these parameters under long-term eCO₂ exposure indicates photosynthetic acclimation [10].
Pathway and Workflow Visualizations
Plant Stress Signaling Pathways
Experimental Stress Phenotyping Workflow
Troubleshooting Guides and FAQs
This technical support center is designed to assist researchers and scientists in diagnosing and resolving common experimental challenges related to nutritional dilution in agricultural research. Nutritional dilution—the decline in nutrient concentration in crops despite increased yield—presents a significant challenge for balancing agricultural productivity with nutritional security [3] [14].
Frequently Asked Questions
What are the primary drivers of nutritional dilution in modern cropping systems? Research indicates that the decline in nutritional quality is multifactorial. Key drivers include: soil degradation from chaotic mineral nutrient application, preference for high-yielding varieties over nutrient-dense cultivars, depletion of soil organic matter, and the shift from natural to chemical farming systems. Elevated atmospheric CO₂ levels have also been shown to extensively reduce nutritional quality, particularly in fruits, vegetables, and staple crops [3].
How significant is the documented decline in nutrient density? The decline is substantial and well-documented across multiple crop types and geographical regions. The following table summarizes key reductions observed in various studies:
Table 1: Documented Nutrient Declines in Crops Over Recent Decades
| Time Period | Crop/Group | Nutrient Reductions Documented | Key Findings |
|---|---|---|---|
| 1940–2019 [3] | Mixed Vegetables | Multiple Minerals | 52% decline in sodium, 50% in iron, 49% in copper, 10% in magnesium. |
| 1963–1992 [3] | 13 US Fruits & Vegetables | Minerals | 29% decline in calcium, 21% in magnesium, 32% in iron. |
| 1975–1997 [15] | Broccoli | Vitamins & Minerals | 56% decline in calcium, 38.3% in Vitamin A, 17.5% in Vitamin C, 20% in iron. |
| 1936–1987 [3] | 20 UK Fruits & Vegetables | Minerals | 19% decline in calcium, 35% in magnesium, 81% in copper. |
What agricultural practices show promise for mitigating nutrient dilution while maintaining yield? Empirical evidence points to moderate-investment practices that emphasize targeted and efficient input application. These strategies can achieve yields comparable to high-investment (input-intensive) practices while significantly reducing environmental costs by approximately $135 per hectare and increasing profits by $23 per hectare [16]. Furthermore, specific interventions like organic amendments, deficit irrigation, and foliar application of amino acids or minerals have been shown to enhance antioxidant content and reduce heavy metal uptake in contaminated soils [17].
Are there trade-offs between increasing crop production and other ecosystem services? Yes, significant trade-offs exist. Research from the Loess Plateau of China demonstrates clear tensions between provisioning services (crop yield) and regulating/supporting services like water yield, soil conservation, carbon sequestration, and biodiversity. Sustainable intensification scenarios that increase agricultural production must be carefully managed to avoid negative impacts on these critical ecosystem functions [18].
Troubleshooting Common Research Challenges
Challenge: Inconsistent nutrient density outcomes in biofortification trials.
- Problem Identification: Biofortification efforts successfully increase target minerals (e.g., zinc, iron, selenium) in grains but inadvertently cause reductions in other beneficial compounds.
- Possible Explanations:
- Nutrient Antagonism: Competition between minerals during plant uptake (e.g., phosphorus-zinc interaction) [17].
- Biochemical Trade-offs: Resource allocation within the plant may shift from secondary metabolites (e.g., antioxidants) to the targeted nutrient.
- Diagnostic Experimentation:
- Implement targeted soil testing to identify pre-existing nutrient imbalances.
- Design experiments that measure a comprehensive panel of nutrients and phytochemicals, not just the target mineral.
- Compare foliar application (which can bypass soil antagonisms) with soil amendment strategies [17].
- Solution: Employ balanced fertilization strategies based on comprehensive soil testing. Consider combined approaches, such as integrating soil amendments with foliar feeding at critical growth stages to mitigate antagonistic effects.
Challenge: Yield reductions when implementing quality-enhancing practices.
- Problem Identification: Transition to practices that improve soil health and nutrient density (e.g., organic amendments, reduced chemical inputs) results in unacceptable yield loss.
- Possible Explanations:
- Transition Period Lag: Soil microbiome and organic matter require time to rebuild ecosystem functions that support yield [3].
- Insufficient Nutrient Availability: Rapid release of soluble nutrients is reduced, creating a temporary deficit.
- Diagnostic Experimentation:
- Conduct phased implementation, converting only portions of experimental plots to track recovery timelines.
- Monitor key soil health indicators (organic matter, microbial biomass) alongside yield and quality metrics.
- Test "moderate-investment" combinations, such as reduced synthetic inputs with complementary organic amendments [16].
- Solution: Implement a graduated transition strategy over multiple growing seasons. Use integrated nutrient management that combines quick-release fertilizers at critical growth stages with slow-release organic sources to build long-term soil health without sacrificing yield during the transition.
Detailed Experimental Protocols
Protocol 1: Evaluating Moderate-Investment Agricultural Practices
Background: This methodology assesses farming strategies that balance input application to optimize both productivity and nutritional quality, thereby mitigating nutritional dilution and environmental impact [16].
Table 2: Research Reagent Solutions for Field Trials
| Reagent/Material | Specification/Function |
|---|---|
| Soil Testing Kit | Pre-experiment analysis of NPK, pH, and organic matter to establish baseline soil fertility. |
| Precision Fertilizer Applicator | Enables targeted and efficient input application as per moderate-investment protocol. |
| Leaf Tissue Sampling Kits | For collecting plant samples at multiple growth stages for nutrient density analysis. |
| Environmental Cost Calculation Matrix | Standardized framework for quantifying externalities ($/hectare) of different practices. |
Procedure:
- Site Selection & Characterization: Select uniform field plots and conduct a comprehensive soil census to characterize chemical and physical properties.
- Treatment Establishment: Implement three distinct management regimes:
- High-Investment: Characterized by intensive, conventional chemical application.
- Moderate-Investment: Defined by targeted, efficient input use based on soil test recommendations.
- Low-Investment: Applies inputs minimally or organically.
- Data Collection:
- Agronomic Data: Record yields at harvest for all treatments.
- Nutritional Analysis: Collect edible portions and analyze for target micronutrients, proteins, and antioxidant compounds.
- Economic & Environmental Metrics: Document input costs, calculate profits, and quantify environmental costs (e.g., greenhouse gas emissions, water pollution).
- Data Analysis: Perform trade-off analysis comparing yield, nutritional density, profitability, and environmental costs across the three management strategies.
Protocol 2: Assessing Trade-offs Between Production and Ecosystem Services
Background: This integrated framework quantifies the trade-offs between agricultural production (a provisioning service) and other key ecosystem services, which is critical for developing sustainable intensification strategies that do not undermine environmental health [18].
Procedure:
- Scenario Definition: Model and/or establish field plots representing different land management scenarios: Business-as-Usual, Ecological Restoration, and Sustainable Intensification.
- Biophysical Modeling & Field Measurement:
- Use models like InVEST and RUSLE to quantify ecosystem services (water yield, soil conservation, carbon sequestration, habitat quality).
- Collect field data on crop yields and net primary productivity (NPP) to measure provisioning services.
- Indicator Integration: Employ a multi-criteria decision analysis (MCDA) or similar framework to integrate the quantified indicators and visualize the trade-offs and synergies between agricultural production and other ecosystem services.
- Strategy Formulation: Based on the analysis, identify management practices within the Sustainable Intensification scenario that provide the best balance between productivity and environmental sustainability.
Welcome to the Technical Support Center for Nutritional Dilution Research. This resource is designed to support researchers and scientists in quantifying and addressing the decline of essential nutrients in staple crops, a phenomenon often referred to as "nutritional dilution." The following guides and FAQs provide structured data, experimental protocols, and key reagents to advance your research in this critical field.
★ Frequently Asked Questions (FAQs)
FAQ 1: What is the historical evidence for nutrient decline in crops? Extensive research over the last half-century to eighty years has documented a significant decline in the nutrient density of fruits, vegetables, and staple crops. The most pronounced depletion has occurred over the last 30-40 years. The table below summarizes key findings from long-term studies [3].
Table 1: Documented Nutrient Declines in Fruits and Vegetables Over the 20th Century
| Nutrient | Documented Decline (%) | Time Period | Crops Analyzed |
|---|---|---|---|
| Copper | 49% - 81% | 1940 to 2019 | Mixed Vegetables & Fruits |
| Iron | 22% - 50% | 1936 - 1991 | Mixed Vegetables & Fruits |
| Sodium | 29% - 52% | 1940 to 2019 | Mixed Vegetables & Fruits |
| Calcium | 16% - 46% | 1936 - 1987 | Mixed Vegetables & Fruits |
| Magnesium | 10% - 35% | 1936 - 1991 | Mixed Vegetables & Fruits |
| Vitamin A | 18% (average) | Past 50 years | 43 Fruits & Vegetables |
| Riboflavin | 38% (average) | Past 50 years | 43 Fruits & Vegetables |
FAQ 2: How does rising atmospheric CO₂ specifically affect crop nutrition? Rising CO₂ levels induce a "carbon dilution effect," where plants accumulate more carbohydrates but have reduced concentrations of proteins and essential micronutrients. This is not just a theoretical model; it has been empirically demonstrated in Open-Top Chamber (OTC) and Free-Air CO₂ Enrichment (FACE) experiments, which simulate future atmospheric conditions [19] [20] [21]. The impact varies by crop and nutrient, as shown in the table below.
Table 2: Nutrient Reduction in Staple Crops Under Elevated CO₂ Conditions
| Staple Crop | Protein Reduction | Iron (Fe) Reduction | Zinc (Zn) Reduction | Experimental Context |
|---|---|---|---|---|
| Global Staples (Wheat, Rice, etc.) | Nearly 10% (average) | Up to 16% (average) | Up to 9% (average) | Meta-analysis of FACE/OTC studies [20] |
| Rice | 6% - 10% (projected) | 3% - 11% (projected) | 3% - 11% (projected) | FACE experiments, CO₂ ~550 ppm [19] |
| Leafy Greens (e.g., Spinach) | Significant reduction observed | Reduction in Calcium & Antioxidants | Not Specified | Growth chamber simulation of UK future climate [22] |
FAQ 3: What are the projected global health impacts of this nutrient decline? By 2050, it is projected that hundreds of millions more people could slip below minimum thresholds for essential nutrients. This will exacerbate existing health inequities, disproportionately affecting vulnerable populations in low-income countries [21].
- Zinc Deficiency: An extra 175 million people could become deficient, increasing vulnerability to malaria, diarrheal diseases, and impaired immune function [21].
- Protein Deficiency: 122 million people could become protein deficient, leading to increased infant mortality and stunted growth [21].
- Iron Deficiency: 1.4 billion women and children under 5 could see their iron intake drop by 4% or more, raising the risk of anemia and cognitive impairment [21].
★ Troubleshooting Guide: Key Experimental Protocols
Protocol 1: Free-Air CO₂ Enrichment (FACE) for Nutrient Impact Studies
Issue: How to experimentally simulate the effect of future CO₂ levels on crop nutrition in a real-world, open-field setting, avoiding the limitations of greenhouse or growth chamber studies.
Solution: The FACE system uses a ring of jets to precisely control and elevate CO₂ concentrations over an open field, allowing plants to be grown in natural conditions while exposed to target CO₂ levels [20] [21].
Experimental Workflow:
Diagram 1: FACE experimental workflow.
Detailed Methodology:
- Site Selection & Baseline Analysis: Select a representative agricultural field. Analyze initial soil chemistry, nutrient content, and microbial activity to establish a baseline [1].
- Install FACE Infrastructure: Erect a ring of CO₂ jets and sensors around the experimental plot. A control plot with identical infrastructure but ambient CO₂ is essential.
- CO₂ Treatment Application: Program the system to release CO₂ to maintain a predetermined elevated concentration (e.g., 550 ppm, 690 ppm). Sensors provide real-time feedback for precise control [20].
- Crop Growth & Monitoring: Grow test crops (e.g., rice, wheat, leafy greens). Monitor photosynthetic markers (e.g., chlorophyll fluorescence, quantum yield), growth rates, and biomass throughout the season [22].
- Harvest & Sample Collection: At maturity, harvest crops from both treatment and control plots. Record yield and biomass. Prepare samples for biochemical analysis.
- Nutritional Quality Analysis: This is the core analytical phase. Use the following techniques:
- High-Performance Liquid Chromatography (HPLC): To measure concentrations of sugars, proteins, phenolic compounds, flavonoids, and vitamins [22].
- X-Ray Fluorescence (XRF) Profiling: To quantify mineral content (e.g., Iron, Zinc, Calcium, Potassium) [22].
- Inductively Coupled Plasma Mass Spectrometry (ICP-MS): For highly sensitive multi-elemental analysis of micronutrients and heavy metals.
- Data Synthesis: Statistically compare the nutritional profiles of crops grown under elevated CO₂ versus ambient conditions to quantify the dilution effect.
Protocol 2: Genomic-Assisted Breeding for Biofortification
Issue: How to develop new crop varieties with enhanced nutritional content to counteract nutrient dilution.
Solution: Leverage molecular markers and quantitative trait locus (QTL) mapping to identify and introgress genes associated with high nutrient density into elite breeding lines [23].
Breeding Workflow:
Diagram 2: Biofortification breeding workflow.
Detailed Methodology:
- Germplasm Screening: Screen diverse germplasm, including wild relatives, landraces, and local cultivars, to identify accessions with naturally high levels of target nutrients (e.g., high zinc, iron, or pro-vitamin A) [23].
- Genetic Analysis & QTL Mapping:
- Cross a high-nutrient donor parent with a high-yielding, adapted elite line to create a mapping population (e.g., Recombinant Inbred Lines - RILs).
- Phenotype the population for nutritional traits.
- Genotype the population using molecular markers (e.g., SNPs, DArT).
- Perform QTL analysis to identify genomic regions significantly associated with the nutritional traits. Examples: QTLs for grain protein content (Gpc) in wheat on chromosomes 1B and 4B; QTLs for pro-vitamin A (crtRB1) in maize on chromosome 10 [23].
- Marker-Assisted Selection (MAS): Develop DNA markers tightly linked to the identified QTLs. Use these markers to screen breeding material and select individuals that carry the desirable nutrient-rich genomic regions.
- Development of Biofortified Lines: Backcross the selected individuals with the elite parent to recover the agronomic background while retaining the high-nutrient QTLs.
- Nutritional Validation: Confirm the enhanced nutritional content of the new biofortified lines using HPLC, XRF, or ICP-MS to ensure the successful introgression of the traits.
★ The Scientist's Toolkit: Research Reagent Solutions
Table 3: Essential Reagents and Materials for Nutritional Dilution Research
| Reagent / Material | Function / Application | Key Consideration |
|---|---|---|
| Free-Air CO₂ Enrichment (FACE) Systems | In-situ exposure of crops to elevated atmospheric CO₂ in open-field conditions. | Gold standard for realism; requires significant infrastructure and funding [20] [21]. |
| Open-Top Chambers (OTCs) | Controlled exposure to elevated CO₂ and temperature for smaller-scale field studies. | More affordable than FACE but creates a semi-closed environment [19]. |
| Molecular Markers (SNPs, SSRs) | Genotyping for QTL mapping and Marker-Assisted Selection in biofortification programs. | Critical for tracking nutrient-related genes (e.g., crtRB1 for pro-vitamin A) without complex phenotyping [23]. |
| HPLC Systems | Separation and quantification of proteins, vitamins, sugars, and antioxidant compounds. | Essential for detailed biochemical profiling of crop quality [22]. |
| X-Ray Fluorescence (XRF) Analyzer | High-throughput, non-destructive measurement of elemental composition (e.g., Zn, Fe, K). | Ideal for rapid screening of mineral content in large numbers of samples [22]. |
| Controlled-Release Fertilizers | Slow nutrient release to match crop uptake, improving Nutrient Use Efficiency (NUE). | Reduces nutrient leaching and can mitigate antagonisms that cause dilution [1]. |
| Biofertilizers / Biostimulants | Microbial inoculants that enhance nutrient solubilization and uptake from soil. | Improves plant access to soil minerals, potentially increasing nutrient density [1]. |
| CRISPR-Cas9 System | Genome editing for precise enhancement of nutrient pathways in crops. | Emerging tool for directly editing genes responsible for nutrient accumulation [23]. |
Building Nutrient Resilience: Practical Agronomic and Genetic Tools
Troubleshooting Common Experimental Challenges
FAQ 1: How can I differentiate between nitrogen deficiency caused by soil health issues versus simple under-fertilization in a no-till system?
Answer: This is a common diagnostic challenge. In a no-till system with cover crops, nitrogen deficiency symptoms (like chlorosis) may not indicate simple fertilizer shortage but rather a temporary nitrogen immobilization caused by high carbon residues. To diagnose:
- Test the Carbon-to-Nitrogen (C:N) Ratio: Analyze the C:N ratio of your cover crop residue or soil organic amendments. Residue with a C:N ratio wider than 30:1 (e.g., mature cereal rye) can tie up nitrogen, while residue with a C:N ratio narrower than 20:1 (e.g., hairy vetch) mineralizes nitrogen quickly [24].
- Conduct a Soil Incubation Test: Incubate a soil sample under controlled conditions and measure mineral nitrogen release over 2-4 weeks. This distinguishes between total nitrogen and plant-available nitrogen.
- Check for Surface Banding: In no-till systems, nitrogen can be stratified in the top few centimeters. Sample soil at different depths (0-5 cm, 5-15 cm, 15-30 cm) to assess nutrient distribution.
- Solution: If immobilization is the issue, consider switching to a cover crop mix that includes legumes (e.g., clover, vetch) to balance the C:N ratio, or adjust the timing of cover crop termination to allow for partial decomposition before planting the cash crop [25].
FAQ 2: My cover crops are failing to establish adequately, leading to poor weed suppression and soil cover. What are the potential causes?
Answer: Poor establishment undermines the core goals of cover cropping. The issue often lies in seeding methodology or species selection.
- Potential Cause 1: Inadequate Seed-to-Soil Contact. In no-till systems, simply broadcasting seed onto compacted residue may fail.
- Potential Cause 2: Incorrect Seeding Rate or Timing.
- Solution: Follow species-specific guidelines. For example, cereal rye should be seeded at 60-120 lbs/acre, while hairy vetch is seeded at 20-40 lbs/acre. Planting too late in the fall does not allow seedlings to establish sufficiently before frost [25].
- Potential Cause 3: Inappropriate Species for Your Climate or Soil.
- Solution: Select cold-hardy species for winter cover (e.g., winter rye, crimson clover) and heat-tolerant species for summer (e.g., sorghum-sudan grass, cowpeas). Using diverse mixes improves the odds of success [25].
FAQ 3: In a field experiment, how do I quantitatively attribute improvements in crop nutritional density directly to a specific soil health practice?
Answer: Isolating the effect of a single practice requires a carefully controlled experimental design and specific metrics.
- Establish Baselines: Pre-treatment, measure baseline soil health indicators (SOC, microbial biomass, aggregate stability) and the nutrient density (minerals, vitamins) of your crop of interest [3].
- Implement Controlled Treatments: Use replicated plots with treatments such as:
- Treatment A: Conventional tillage + inorganic fertilizer (control).
- Treatment B: No-till + inorganic fertilizer.
- Treatment C: No-till + cover crops + inorganic fertilizer.
- Treatment D: No-till + cover crops + organic amendments (e.g., biochar, compost) [27].
- Track Correlation and Causation: Use regression analysis to correlate changes in specific soil health parameters (e.g., percent increase in SOC, microbial activity) with changes in the concentration of target nutrients in the crop (e.g., iron, zinc, vitamin C). This helps move beyond simple correlation to a stronger causal inference [1] [3].
Quantitative Data on Strategy Efficacy
Table 1: Impact of Integrated Strategies on Soil Health and Crop Outcomes
| Strategy | Key Metric | Result | Experimental Context | Source |
|---|---|---|---|---|
| No-Till + Cover Crop + Biochar | Soil Organic Carbon (SOC) Stock | Increased in top 0-30 cm profile | Randomized complete block study on Andosol; Japan | [27] |
| No-Till + Cover Crop + Biochar | Soil Bulk Density & Penetration Resistance | Reduced, improving soil structure | Randomized complete block study on Andosol; Japan | [27] |
| Integrated Nutrient Management (INM) | Crop Yield | 8% to 150% increase vs. conventional | Systematic review of 65 peer-reviewed studies | [1] |
| 75% NPK + Farmyard Manure + Bioinoculants | Productivity & Soil Health | High productivity achieved while reducing chemical fertilizer reliance | Field and greenhouse experiments | [1] |
| Cover Crop Mix (Turnips, Cowpeas, Lentils) | Subsequent Corn Yield | Increased by 18-20 bushels per acre | On-farm trials, South Dakota | [26] |
Table 2: Documented Decline in Food Nutrient Density (Context for Research Urgency)
| Food Category | Nutrient | Documented Decline | Time Period | Source |
|---|---|---|---|---|
| Fruits & Vegetables | Iron | Up to 50% | 1940-2019 | [3] |
| Fruits & Vegetables | Copper | Up to 49% | 1940-2019 | [3] |
| Vegetables (20 varieties) | Calcium | 19% | 1936-1991 | [3] |
| Vegetables (20 varieties) | Magnesium | 35% | 1936-1991 | [3] |
| 43 Fruits & Vegetables | Protein | 6% | ~50 years | [3] |
| 43 Fruits & Vegetables | Vitamin B2 (Riboflavin) | 38% | ~50 years | [3] |
Detailed Experimental Protocols
Protocol 1: Establishing a No-Till System with Cover Crops for Nutrient Density Research
Objective: To transition from conventional tillage to a no-till system integrated with cover crops and measure the impact on soil health parameters and crop nutrient density.
Materials: No-till drill, roller-crimper or mower, cover crop seeds, soil corer, soil test kits, plant tissue sampling equipment.
Methodology:
- Site Selection & Baseline Sampling: Select a uniform field area. Collect composite soil samples (0-15 cm and 15-30 cm depths) for standard nutrient analysis, SOC, and microbial biomass carbon. Harvest the current cash crop and analyze its nutrient content.
- Cover Crop Establishment:
- Timing: Plant immediately after harvest of the main crop.
- Species Selection: Use a diverse mix. A standard mix for cool seasons could be cereal rye (biomass producer), hairy vetch (N-fixer), and forage radish (for compaction breakup) [25].
- Planting: Use a no-till drill to plant the cover crop mix into the crop residue. Ensure good seed-to-soil contact [26].
- Cover Crop Termination:
- Timing: Terminate at full flowering (anthesis) for cereals or at mid-bloom for legumes. This is when the plants are easiest to kill and have accumulated maximum biomass [25].
- Method: Use a roller-crimper or mower to terminate the cover crop, creating a thick mulch layer on the soil surface.
- Cash Crop Planting: Plant the cash crop (e.g., soybeans, corn) directly into the cover crop residue using a no-till planter.
- Data Collection: Monitor soil moisture, temperature, and weed pressure. At cash crop harvest, collect yield data and tissue samples for detailed nutrient analysis. Repeat soil sampling annually to track changes in SOC and other health indicators.
Protocol 2: Evaluating the Impact of Organic Amendments on Nutrient Availability
Objective: To assess the effect of biochar and compost on soil nutrient cycling, microbial activity, and subsequent crop nutrient density.
Materials: Biochar, compost, plot markers, soil moisture and temperature sensors, equipment for measuring soil respiration.
Methodology:
- Experimental Design: Set up a randomized complete block design with treatments like: a) Control (inorganic fertilizer only), b) Inorganic fertilizer + Compost, c) Inorganic fertilizer + Biochar, d) Inorganic fertilizer + Compost + Biochar [27].
- Amendment Application: Source standardized, well-characterized biochar and compost. Apply amendments uniformly to plots according to treatment specifications and incorporate lightly into the topsoil (unless in a strict no-till system, where it would be surface-applied).
- Monitoring: Regularly measure:
- Soil Physico-chemical Properties: SOC, pH, CEC, bulk density.
- Biological Activity: Soil respiration (CO2 flux), microbial biomass carbon/nitrogen.
- Nutrient Availability: In-season soil nitrate and ammonium tests.
- Plant Analysis: At key growth stages (e.g., flowering) and at harvest, collect plant tissue to analyze for macro- and micronutrients. Compare the results across treatments to identify amendments that enhance nutrient uptake and reduce dilution effects.
Conceptual Workflow and Pathways
Soil Health Pathway to Reduce Nutritional Dilution
The Scientist's Toolkit: Research Reagent Solutions
Table 3: Essential Materials and Reagents for Soil Health Research
| Item | Function in Research | Application Notes |
|---|---|---|
| No-Till Drill | Plants seeds directly into previous crop residue with minimal soil disturbance. | Critical for maintaining the integrity of no-till experimental plots. Ensures good seed-to-soil contact. |
| Roller-Crimper | Mechanically terminates cover crops by crushing stems without cutting. | Creates a uniform mulch layer that suppresses weeds and conserves moisture. |
| Biochar | Stable carbon-rich soil amendment. Improves water and nutrient retention, provides microbial habitat. | Source and production temperature (pyrolysis) significantly impact its properties. Characterize before use [27]. |
| Legume Cover Crop Seeds (e.g., Hairy Vetch, Clover) | Biological nitrogen fixation; reduces need for synthetic N fertilizers. | Inoculate seeds with appropriate Rhizobium strains to ensure effective nodulation and N-fixation [25]. |
| Grass Cover Crop Seeds (e.g., Cereal Rye, Oats) | Produces high biomass, scavenges residual soil nitrogen, prevents leaching. | High C:N ratio can immobilize N if not managed correctly. Terminate at flowering [24] [25]. |
| Soil Cores & Microbial Biomass Kits | For collecting undisturbed soil samples and quantifying active soil microbial population. | Essential for measuring changes in Soil Organic Carbon (SOC) and biological activity over time. |
| Plant Tissue Testing Kits | For precise quantification of micronutrients and macronutrients in harvested crops. | Used to directly measure the outcome variable—nutritional density—against experimental treatments. |
FAQs: Core Concepts of Integrated Nutrient Management
What is the primary goal of INM in modern agricultural research? The primary goal of INM is to develop sustainable nutrient management strategies that synergistically combine organic and inorganic sources. This approach aims to maintain high crop productivity, improve soil health, enhance nutrient use efficiency, and reduce environmental impacts, thereby addressing issues like soil degradation and nutritional dilution in food systems [1] [28].
How does INM help in reducing nutritional dilution in crops? Nutritional dilution occurs when crop yields are prioritized at the expense of nutrient density. INM combats this by fostering a balanced soil ecosystem. Integrated application of chemical fertilizers with organic amendments like farmyard manure (FYM) and bio-inoculants has been shown to significantly improve nutrient concentrations (N, P, K, Zn, Fe) and their uptake in plants, ensuring that high yields do not come at the cost of nutritional quality [29] [1].
What are the common challenges researchers face when designing long-term INM experiments? Key challenges include selecting appropriate treatment combinations, managing the logistics of long-term field experiments, and accurately measuring soil health indicators. Best practices recommend a minimum of 3-4 biological replicates to account for variability and ensure statistical robustness [30]. Long-term studies, such as those spanning over 30 years, are crucial to understanding the cumulative benefits of INM on soil ecosystem services [28].
Troubleshooting Common INM Experimental Issues
Issue: Inconsistent crop yield responses to INM treatments.
Solution: Ensure the balanced integration of nutrient sources. A study on a maize-berseem-cowpea system found that the most effective treatment (T7) combined 100% recommended nitrogen through FYM, plant growth-promoting rhizobacteria (PGPR), and a 3% foliar spray of Panchagavya. This combination significantly improved green fodder yields over three consecutive years [29]. In a rice-rice system, the combination of recommended chemical fertilizers with FYM or Azolla led to enhanced soil health and sustained yields [28]. Verify that your treatment design includes complementary inputs to meet both immediate and long-term crop nutrient demands.
Issue: Unclear or minimal improvements in soil health parameters. Solution: Focus on measuring sensitive biological indicators. Research shows that long-term INM practices significantly alter soil microbiological properties. For instance:
- Treatment
RDF + Azollaresulted in the highest bacterial count and dehydrogenase activity. - Treatment
RDF + FYMled to the highest fungal count and phosphomonoeasterase activity [28]. If improvements are not observed, consider the application rates and quality of your organic amendments, and allow sufficient time for these inputs to influence the soil ecosystem.
Issue: Low Nutrient Use Efficiency (NUE) persists in the system. Solution: Integrate precision agriculture technologies and advanced fertilizer formulations. Strategies include:
- Adopting the 4Rs of nutrient stewardship (right source, rate, time, and place) [1].
- Using slow- and controlled-release fertilizers to minimize losses [1].
- Implementing site-specific nutrient management (SSNM) to tailor applications to field variability [1]. These approaches can significantly enhance NUE, reduce nutrient losses, and improve the overall effectiveness of your INM strategy.
Quantitative Data from INM Studies
Table 1: Crop Yield Response to INM in a Maize-Berseem-Cowpea System (2018-2021) [29]
| Treatment Description | Crop | Green Fodder Yield (t ha⁻¹) 2018-19 | Green Fodder Yield (t ha⁻¹) 2019-20 | Green Fodder Yield (t ha⁻¹) 2020-21 |
|---|---|---|---|---|
| 100% RDN via FYM + PGPR + Panchagavya (T7) | Maize | 35.4 | 37.0 | 38.6 |
| 100% RDN via FYM + PGPR + Panchagavya (T7) | Berseem | 58.2 | 60.0 | 60.6 |
| 100% RDN via FYM + PGPR + Panchagavya (T7) | Cowpea | 25.7 | 27.5 | 28.3 |
Table 2: Soil Biological Properties under Long-Term INM in a Rice-Rice System (32 years) [28]
| Treatment | Microbial Biomass Carbon (µg g⁻¹) | Bacterial Count (log cfu g⁻¹) | Fungal Count (log cfu g⁻¹) | Dehydrogenase Activity (µg TTF g⁻¹ 24 h⁻¹) | Phosphomonoeasterase Activity (µg p-nitrophenol g⁻¹ h⁻¹) |
|---|---|---|---|---|---|
| RDF + Azolla | 412.1 | 8.95 | 7.18 | 223.6 | 295.2 |
| RDF + FYM | 392.4 | 8.45 | 7.47 | 191.5 | 337.4 |
| Control (No nutrients) | 129.4 | 7.12 | 6.21 | 52.1 | 152.6 |
RDF: Recommended Dose of Fertilizers; FYM: Farmyard Manure
Experimental Protocols for INM Research
Protocol 1: Field Evaluation of INM in a Sequential Cropping System
This methodology is adapted from a three-year field study on a maize-berseem-cowpea fodder system [29].
1. Experimental Design and Setup:
- Site Selection: Choose a representative site with known soil history. Initial soil analysis is critical for establishing baseline fertility (e.g., pH, organic carbon, available N, P, K).
- Design: Employ a Randomized Complete Block Design (RCBD) with a minimum of 3-4 replications to account for field variability [30].
- Treatment Structure: Include 7 or more treatments to compare:
- T1: 100% recommended NPK via inorganic fertilizers (control).
- T2: 100% RDN through FYM.
- T3-T6: Combinations of 50-75% RDN through FYM + remaining N through fertilizers.
- T7: 100% RDN through FYM + PGPR seed treatment + 3% foliar spray of Panchagavya.
2. Treatment Application:
- Inorganic Fertilizers: Apply as per treatment specification, with N splits for maize (half at sowing, half 30 DAS) and full dose at sowing for berseem and cowpea. Apply P and K as basal doses.
- Organic Amendments (FYM): Apply as a basal dose during field preparation, calculated based on its nitrogen content.
- Bio-inoculants (PGPR): Treat seeds with PGPR as per manufacturer's instructions before sowing.
- Panchagavya: Apply as a 3% foliar spray at critical growth stages of each crop.
3. Data Collection and Analysis:
- Plant Growth Metrics: Record plant height, leaf area, and dry matter accumulation at different stages.
- Yield Attributes: Measure green fodder yield (t ha⁻¹) and grain yield if applicable.
- Nutrient Uptake: Analyze plant tissue samples for N, P, K, and micronutrients (Zn, Fe).
- Soil Health Indicators: Post-harvest, analyze soil for available N, P, K, organic carbon, and microbial properties.
Protocol 2: Assessing Soil Microbial and Enzymatic Responses to INM
This protocol is derived from a long-term experiment on a double rice-cropping system [28].
1. Soil Sampling:
- Collect soil samples from the root zone (0-15 cm depth) at critical growth stages or after harvest.
- Process samples by sieving (2 mm) and store a subset at 4°C for biological analysis.
2. Microbial Biomass Carbon (MBC) Determination:
- Use the chloroform fumigation-extraction method.
- Fumigate soil samples with ethanol-free chloroform for 24 hours in a desiccator.
- Extract both fumigated and non-fumigated soils with 0.5 M K₂SO₄.
- Analyze the organic carbon in the extracts and calculate MBC using the formula: MBC = (Carbon from fumigated soil - Carbon from non-fumigated soil) / KEC, where KEC is a conversion factor (typically 0.45).
3. Microbial Population Count:
- Perform serial dilutions of soil suspensions.
- Plate onto appropriate media (e.g., nutrient agar for bacteria, Rose Bengal agar for fungi).
- Incubate and count colony-forming units (cfu g⁻¹ soil), converting to log values.
4. Soil Enzyme Assays:
- Dehydrogenase Activity: Measure by incubating soil with TTC (triphenyltetrazolium chloride) and quantifying the reduced TPF (triphenylformazan).
- Phosphomonoeasterase (Acid Phosphatase) Activity: Incubate soil with p-nitrophenyl phosphate and measure the released p-nitrophenol.
- Urease Activity: Incubate soil with urea and determine the released ammonium nitrogen.
- Fluorescein Diacetate (FDA) Hydrolysis: Incubate soil with FDA and measure the fluorescein released, indicating overall microbial activity.
INM Experimental Workflow and Pathways
Diagram 1: INM experimental workflow from design to outcome.
Diagram 2: INM pathways to improved crop performance and reduced nutritional dilution.
The Scientist's Toolkit: Key Research Reagent Solutions
Table 3: Essential Materials and Reagents for INM Research
| Item | Function in INM Research | Application Example |
|---|---|---|
| Farmyard Manure (FYM) | Provides slow-release macro/micronutrients, improves soil structure and water retention [29] [28]. | Basal application at calculated N rate; e.g., 100% RDN through FYM [29]. |
| Plant Growth-Promoting Rhizobacteria (PGPR) | Bio-inoculants that fix N, solubilize P, produce phytohormones; enhance nutrient uptake and root development [29]. | Seed treatment before sowing [29]. |
| Panchagavya | Traditional bio-formulation rich in nutrients, hormones, and beneficial microbes; promotes plant metabolism and growth [29]. | 3% foliar spray at critical crop growth stages [29]. |
| Azolla | Aquatic fern that fixes atmospheric nitrogen; used as biofertilizer to supplement N in cropping systems [28]. | Application in rice fields to enhance N availability and boost bacterial populations [28]. |
| Chloroform | Organic solvent used for fumigation in the microbial biomass carbon determination assay [28]. | Soil fumigation prior to extraction for MBC calculation. |
| p-Nitrophenyl Phosphate | Synthetic substrate used for quantifying phosphomonoeasterase enzyme activity in soil [28]. | Incubated with soil sample; enzyme activity measured by yellow color intensity from p-nitrophenol release. |
| Triphenyltetrazolium Chloride (TTC) | Colorless, water-soluble compound accepted by dehydrogenases and reduced to red, insoluble triphenylformazan (TPF) [28]. | Used as an electron acceptor in the assay to measure total soil dehydrogenase activity. |
| Fluorescein Diacetate (FDA) | Substrate hydrolyzed by a broad range of enzymes (proteases, lipases, esterases); indicator of total microbial activity [28]. | Incubated with soil; hydrolysis measured by spectrophotometric detection of fluorescein. |
The Scientist's Toolkit: Core Technologies & Reagents
The following table details the key technologies that function as the essential "research reagents" in modern precision agriculture experiments focused on nutritional outcomes.
| Technology / Solution | Primary Function in Research | Key Metric / Specification | Relevance to Nutritional Dilution |
|---|---|---|---|
| Multispectral/Hyperspectral Satellite Imagery [31] [32] | Measures crop reflectance to assess plant health and vigor (e.g., via NDVI). | Spatial Resolution: Sub-meter to meters; Spectral Bands: 4+ (Red, Green, Blue, NIR, Red Edge) [32]. | Detects subtle nutrient deficiency patterns across large field trials before visual symptoms appear, allowing for targeted correction. |
| AI-Powered Predictive Analytics [31] [32] | Analyzes historical & real-time data (imagery, weather, soil) to forecast yield and quality. | Prediction Accuracy: Can exceed 90% in detection tasks; leading yield models report ~98% accuracy [32] [33]. | Models the impact of specific interventions (e.g., micronutrient application) on final crop nutritional density, not just yield. |
| Soil & IoT Sensor Networks [34] [32] [35] | Provides real-time, continuous data on soil moisture, temperature, and nutrient levels. | Parameters: Soil moisture, temperature, NPK levels, electrical conductivity [32]. | Enables precise management of soil moisture and nutrients, key factors in preventing nutrient dilution from imbalanced irrigation or fertilization. |
| Variable Rate Technology (VRT) Systems [34] [36] | Precisely applies water, fertilizers, or other inputs at variable rates across a field based on prescription maps. | Input Reduction: Can reduce fertilizer and pesticide use by 20-70% [31] [32] [36]. | The execution tool for targeted nutritional interventions, applying supplements only where needed to optimize nutrient uptake. |
| Agricultural Drones (UAVs) [34] [32] | High-resolution aerial imaging and targeted spraying for small-scale experimental plots. | Application Impact: Can reduce pesticide use by up to 30% and enable targeted input application [32] [36]. | Ideal for high-precision phenotyping and applying experimental nutrient formulations in controlled field trials. |
Experimental Protocols for Nutritional Research
Protocol: Mapping Micronutrient Availability Using Remote Sensing
Objective: To establish a correlation between satellite-derived vegetation indices and foliar nutrient concentrations to identify zones of potential nutritional dilution.
Materials:
- Satellite imagery (e.g., Sentinel-2, Planet) with Red-Edge and Near-Infrared bands [32].
- GNSS/GPS receiver with submeter accuracy [37].
- Leaf sample collection kits (punches, bags, coolers).
- Access to a lab for foliar nutrient analysis.
Methodology:
- Scheduled Image Acquisition: Capture multispectral satellite imagery at key crop growth stages (e.g., stem elongation, flowering) [32].
- Generate Vegetation Indices: Calculate indices like NDVI (broad health) and NDRE (chlorophyll/content sensitivity) for the entire research area [32].
- Stratified Sampling: Based on index variability, stratify the field into high, medium, and low vigor zones. Within each zone, randomly assign geotagged sampling points [34].
- Field Sampling: At each point, collect leaf samples from a defined number of plants, record GPS coordinates, and process for lab analysis of target micronutrients (e.g., Zinc, Iron).
- Data Integration & Model Building: Integrate lab results with corresponding vegetation index values in a statistical model. Use regression analysis to establish a predictive relationship between spectral data and nutrient concentration [31] [32].
- Validation: Validate the model's accuracy using a separate set of ground-truthed samples.
Protocol: Implementing a Targeted Nutritional Intervention with VRT
Objective: To assess the efficacy of a variable-rate nutritional application in reducing the spatial variability of a target micronutrient in the harvested crop.
Materials:
- Prescription map from Protocol 1.
- VRT-capable sprayer or spreader [34] [36].
- Control and treatment formulations of the nutritional supplement.
Methodology:
- Prescription Map Development: Using the model from Protocol 1, create an application map that specifies a higher rate of nutritional supplement in zones predicted to have low nutrient concentration and a lower or zero rate in zones with sufficient levels [31] [34].
- Experimental Design: Establish control plots (uniform application) and treatment plots (variable-rate application) with sufficient replication.
- Precision Application: Use the VRT system to apply the supplement according to the prescription map. Log as-applied data to verify compliance [34].
- Post-Harvest Analysis: During harvest, use a yield monitor to collect georeferenced yield data. Collect grain/tissue samples from corresponding zones in both control and treatment plots.
- Efficacy Assessment: Analyze the harvested samples for nutrient concentration. Compare the variability and mean concentration between control and treatment plots to determine the intervention's success in homogenizing and elevating nutritional quality [38].
Technical Support Center: Troubleshooting Guides & FAQs
FAQ: Data & Connectivity
Q1: Our field site has poor internet connectivity. How can we ensure reliable data transmission from IoT sensors?
A: This is a common challenge in rural research areas. Consider these solutions:
- Edge Computing: Use sensors or gateways with edge processing capabilities to perform initial data filtering and storage locally, transmitting only summarized data packets when a connection is available [39].
- LoRaWAN or Mesh Networks: Implement a Long-Range Wide Area Network (LoRaWAN) or a mobile mesh network that creates a local communication infrastructure independent of cellular data, which can then batch-send data to a central hub [39].
- Manual Data Retrieval: For small-scale, fixed plots, using data loggers with physical retrieval remains a reliable, though labor-intensive, fallback.
Q2: We are seeing a discrepancy between drone and satellite NDVI values for the same plot. Which data source should we trust?
A: Discrepancies are often due to different spatial resolutions and atmospheric conditions.
- Check Spatial Resolution: Drone imagery typically has a much higher resolution (centimeters) than satellite imagery (meters). The satellite pixel might be averaging the signal from the plant and any exposed soil, lowering the NDVI value [32] [36]. Ensure you are comparing data at a comparable scale.
- Verify Acquisition Time: Atmospheric haze, clouds, or different sun angles at the time of capture can affect readings. Always use atmospherically corrected satellite data and try to align acquisition times as closely as possible [32].
- Calibration: Use ground-based spectroradiometer measurements to calibrate both your drone and satellite-derived indices for your specific crop and conditions.
FAQ: Implementation & Analysis
Q3: Our AI yield prediction model is performing well overall but is highly inaccurate in specific parts of the field. What could be the cause?
A: This is often a sign of algorithmic bias or insufficient model training data for certain soil or management conditions [33].
- Root Cause Analysis: Investigate the inaccurate zones. Are they characterized by a specific soil type, a history of pest pressure, or a different management history that isn't well-represented in the model's training data? [33].
- Solution: Retraining with Targeted Data: Collect more ground-truthed data (e.g., hand-harvested yields) specifically from these underperforming zones and retrain your model with this enriched dataset. Techniques like "transfer learning" can also be explored to adapt a general model to your specific field anomalies [31] [33].
Q4: How can we effectively track the impact of our interventions on nutritional content without testing every single plant?
A: Leverage the stratified sampling approach from Protocol 1.
- Zone-Based Sampling: Do not sample randomly. Use your satellite-derived zones (e.g., high, medium, low vigor) as your sampling strata. This ensures you capture the full range of variability with far fewer samples [34].
- Composite Sampling: Within each zone and for each treatment, create a composite sample by combining tissue from multiple plants. This provides a representative value for the zone and reduces the number of lab tests required.
- Correlation with Proxies: Continue to refine your models (from Protocol 1) to use reliable spectral proxies, reducing the future need for intensive lab work.
Workflow Visualization
Research Workflow for Nutritional Fortification
This workflow outlines the core feedback loop for designing, implementing, and assessing targeted nutritional interventions, integrating the tools and protocols detailed above.
Modern agriculture faces a critical challenge often termed "nutritional dilution," where the focus on high-yielding cultivars has inadvertently led to a decline in the micronutrient content of staple foods. Studies tracking mineral content in fruits and vegetables have documented a consistent decline over time, with analysis from 1963 to 1992 revealing reductions in calcium (29%), magnesium (21%), and iron (32%) [40]. This trend, coupled with micronutrient deficiencies that affect over three billion people globally, creates a significant public health crisis known as "hidden hunger" [41] [42].
Biofortification has emerged as a powerful and sustainable strategy to counter this trend. It uses plant breeding and genetic engineering to increase the density of vitamins and minerals in staple crops, effectively leveraging the existing food system to deliver better nutrition [43] [44]. By embedding nutritional traits directly into high-yielding, agronomically superior crop varieties, biofortification provides a cost-effective and scalable solution to improve nutrient availability, particularly for low-income populations whose diets are heavily reliant on a few staple foods [43] [41]. This technical support center is designed to assist researchers in overcoming the practical challenges of developing these nutrient-enhanced varieties.
FAQs: Addressing Common Research Challenges
What is the fundamental rationale for using biofortification over other nutritional interventions? Biofortification is considered a cost-effective and sustainable strategy because it "lets the plants do the work." Once the initial development is complete, it avoids the recurrent annual costs associated with supplementation and commercial fortification. Biofortified crops are developed as high-yielding, agronomically superior varieties, giving farmers every incentive to adopt them. As these productive and nutritious varieties spread through the food system, consumers can increase their mineral and vitamin intakes at no additional cost by simply substituting biofortified staples for non-biofortified ones [43] [44].
How significant is the contribution of staple crops to micronutrient intake, and why focus on them? Staple crops provide a substantial base of mineral and vitamin intakes in low- and middle-income countries (LMICs). Data from Nutrient Balance Sheets show that in Africa and Asia, primary staples provide more than 50% of the total intake of iron, zinc, thiamine (vitamin B1), niacin (vitamin B3), and several other essential minerals and B vitamins. They also contribute important, though lower, quantities in Latin America. This makes them a powerful vehicle for delivering nutrients to the most vulnerable populations [44].
Will biofortified crops be accepted by farmers and consumers, especially if the nutrients change the crop's color? Evidence from over 40 countries demonstrates that biofortified crops can be successfully adopted. For example, in Rwanda, biofortified iron beans were adopted due to their 20-23% higher yields compared to local varieties. In Nigeria, millions of farm households have adopted vitamin A cassava and maize, which have a yellow or orange color, indicating that a change in color has not been a barrier to adoption when the agronomic traits are superior. Extensive research on "willingness to pay" supports that consumers will accept nutrient-dense crops, with or without information about the color change [44].
What are the future challenges and opportunities for biofortification? A key challenge is the current funding and coordination landscape. Centralized funding and management structures have diminished, making it more difficult to coordinate research and deployment across different crops and disciplines [44]. To reach a higher impact trajectory, future efforts must leverage advanced agricultural techniques. This includes using genetic engineering and genome editing to combine multiple-nutrient densities with climate-smart traits in a single crop, moving beyond increasing single nutrients [43] [42].
Troubleshooting Guides for Biofortification Experiments
Troubleshooting CRISPR-Cas9 Gene Editing in Plants
CRISPR-Cas9 has revolutionized genetic engineering by offering unprecedented precision, but researchers often encounter specific technical hurdles. The following table outlines common issues and their solutions.
Table 1: Troubleshooting Common CRISPR-Cas9 Problems in Crop Biofortification
| Problem | Possible Causes | Recommended Solutions | Preventive Measures |
|---|---|---|---|
| Low Editing Efficiency [45] | Poor gRNA design, inefficient delivery method, low expression of Cas9/gRNA. | Design gRNA with high on-target score using prediction algorithms [46]. Optimize delivery (e.g., electroporation, viral vectors) for your specific cell type. Use a cell-type-specific promoter and codon-optimize Cas9. | Validate gRNA design with software like that from the Wyss Institute [46]. Test multiple delivery methods and promoters. |
| High Off-Target Effects [45] | gRNA sequence is not specific enough, leading to cuts at unintended genomic sites. | Use online tools to design highly specific gRNAs and predict potential off-target sites. Employ high-fidelity Cas9 variants. | Perform whole-genome sequencing on edited lines to identify and screen out unwanted mutations. |
| Cell Toxicity [45] | High concentrations of CRISPR-Cas9 components. | Titrate the concentration of Cas9-gRNA ribonucleoprotein (RNP) complexes. Use lower doses and optimize delivery. | Use a Cas9 protein with a nuclear localization signal to enhance efficiency at lower doses. |
| Mosaicism [45] | Editing occurs after the first cell division, leading to a mix of edited and unedited cells in the same organism. | Optimize the timing of delivery to target early cell stages. Use inducible Cas9 systems. Perform single-cell cloning to isolate fully edited cell lines. | Use meristem-specific promoters to target the germline and reduce chimerism in the next generation. |
| Inability to Detect Edits [45] | Insensitive genotyping methods. | Use robust detection methods like T7 endonuclease I assay, Surveyor assay, or Sanger sequencing. For complex edits, use next-generation sequencing. | Include positive and negative controls in every genotyping experiment [45]. |
The following workflow diagram illustrates the key steps and decision points for a successful CRISPR-Cas9 experiment in plants, integrating the troubleshooting aspects.
Troubleshooting Metabolic Pathway Engineering
Engineering entire metabolic pathways, such as for β-carotene (Golden Rice) or anthocyanins (Purple Tomatoes), introduces multi-gene challenges.
Table 2: Troubleshooting Multi-Gene Metabolic Pathway Engineering
| Problem | Possible Causes | Recommended Solutions |
|---|---|---|
| Unbalanced Gene Expression [47] | Competition for cellular resources, promoter incompatibility, transcriptional silencing. | Use a suite of compatible promoters with varying strengths. Implement synthetic transcription factors to fine-tune expression. Consider linking genes in a polycistronic unit. |
| Low End-Product Accumulation [40] [42] | Rate-limiting steps in the pathway, poor substrate availability, diversion of intermediates to other pathways, lack of proper storage sinks. | Overexpress the rate-limiting enzyme (e.g., phytoene synthase for carotenoids [40]). Co-express transporters to enhance substrate flux. Suppress competing pathways using RNAi or CRISPRi. Engineer the formation of storage organelles (e.g., chromoplasts [40]). |
| Unexpected Metabolic Consequences | Metabolic burden on the plant, toxicity of intermediates, pleiotropic effects. | Use tissue-specific or inducible promoters to confine expression. Screen for and eliminate toxic intermediates. Perform thorough metabolomic and phenotypic analysis across generations. |
| Instability of the Trait [47] | Transgene silencing, meiotic instability of complex loci. | Include matrix attachment regions (MARs) to prevent silencing. Use genome editing to insert the pathway as a single copy into a genomic "safe harbor" locus. |
Essential Experimental Protocols
Protocol: Agrobacterium-Mediated Transformation of Rice for Biofortification
This is a generalized protocol for transforming rice, a major staple crop, based on established genetic engineering principles [42].
1. Preparation of Explants:
- Sterilize mature rice seeds (dehusked) with 70% ethanol for 1 minute, followed by commercial bleach (2-2.5% sodium hypochlorite) for 20-30 minutes with gentle shaking.
- Rinse thoroughly 3-5 times with sterile distilled water.
- Place the sterilized seeds on callus induction medium (e.g., N6 medium with 2,4-D). Incubate in the dark at 25-28°C for 2-3 weeks to induce embryogenic calli.
2. Co-cultivation with Agrobacterium:
- Pick a single colony of Agrobacterium tumefaciens (e.g., strain EHA105 or LBA4404) harboring your binary vector (e.g., with genes for β-carotene biosynthesis [40] [42]) and inoculate in liquid culture medium with appropriate antibiotics. Grow overnight at 28°C with shaking.
- Pellet the bacteria by centrifugation and resuspend in liquid co-cultivation medium to an OD₆₀₀ of 0.8-1.0.
- Immerse the embryogenic calli in the Agrobacterium suspension for 15-30 minutes. Blot the calli on sterile filter paper to remove excess bacteria and transfer to solid co-cultivation medium. Incubate in the dark at 22-25°C for 2-3 days.
3. Selection and Regeneration:
- After co-cultivation, transfer the calli to resting medium (with antibiotics like cefotaxime or timentin to kill the Agrobacterium) without selection pressure for about a week.
- Transfer the calli to selection medium containing both antibiotics to kill Agrobacterium and a selective agent (e.g., hygromycin) to select for transformed plant cells. Subculture every two weeks.
- Once resistant calli proliferate, transfer them to pre-regeneration and then regeneration medium (with cytokinins and reduced or no auxins) to induce shoot formation. Maintain under a 16/8 hour light/dark cycle.
4. Rooting and Acclimatization:
- When shoots reach 2-3 cm, excise and transfer to rooting medium (with auxins like IAA or NAA).
- Once a healthy root system develops, carefully transplant the plantlets into soil pots in a controlled environment. Cover with plastic to maintain high humidity initially and gradually acclimate them to ambient conditions.
Protocol: Rapid Genotyping of CRISPR-Edited Plants using T7 Endonuclease I (T7EI) Assay
This protocol allows for the quick detection of induced mutations before sequencing [45].
1. DNA Extraction and PCR:
- Extract genomic DNA from a small amount of leaf tissue (~50-100 mg) of putative transgenic and wild-type control plants using a CTAB-based method or a commercial kit.
- Design PCR primers that flank the target CRISPR-Cas9 site (amplicon size 400-800 bp). Perform PCR amplification using a high-fidelity DNA polymerase.
2. DNA Heteroduplex Formation:
- Purify the PCR products.
- Denature and reanneal the PCR products to form heteroduplex DNA: 95°C for 5 minutes, then ramp down to 85°C at -2°C/second, then to 25°C at -0.1°C/second. This process allows strands from differently edited alleles (or wild-type and edited) to hybridize, creating mismatches at the cut site.
3. T7 Endonuclease I Digestion:
- Prepare a digestion reaction: 8 μL of reannealed PCR product, 1 μL of NEB Buffer 2, 1 μL of T7 Endonuclease I enzyme.
- Incubate at 37°C for 15-60 minutes.
- Include a control reaction with wild-type PCR product.
4. Analysis by Gel Electrophoresis:
- Run the digested products on a 2-2.5% agarose gel.
- The presence of cleaved bands (in addition to the full-length PCR product) indicates a successful edit. The wild-type control should show only a single, uncut band.
The Scientist's Toolkit: Key Research Reagents
Table 3: Essential Reagents for Biofortification Research
| Reagent / Tool | Function / Application | Example Use in Biofortification |
|---|---|---|
| CRISPR-Cas9 System [45] [42] | Precise genome editing to knock out genes (e.g., anti-nutrients) or edit regulatory sequences. | Developing high-GABA tomatoes by knocking out the autoinhibitory domain of the SlGAD3 gene [40]. |
| T7 Endonuclease I Assay [45] | A fast and inexpensive method to detect successful genome edits by cleaving DNA heteroduplexes with mismatches. | Initial screening of edited lines for mutations in genes involved in phytate biosynthesis (to improve mineral bioavailability). |
| Agrobacterium tumefaciens [42] | A natural soil bacterium used as a vector to introduce foreign genes into plant cells. | Used in the development of Golden Rice to introduce the phytoene synthase (psy) and carotene desaturase (crtI) genes [40] [42]. |
| Guide RNA (gRNA) Design Tools [46] | Software algorithms to predict the most effective and specific gRNA sequences for a target gene, minimizing off-target effects. | Designing gRNAs to precisely edit promoters of nutrient transporter genes (e.g., for iron or zinc) to enhance their expression. |
| SOC Medium [48] | A rich recovery medium used after bacterial transformation to allow cells to express antibiotic resistance genes. | Crucial for efficient recovery of E. coli after transformation with plasmid constructs meant for plant transformation. |
| Advanced DMEM/F12 Medium [49] | A complex basal medium used for maintaining and growing various cell types, including in tissue culture. | Used as a base for plant tissue culture media to support the growth of explants like callus during transformation. |
Foundational Knowledge: Bio-Inputs and Nutritional Quality
Bio-inputs, encompassing biofertilizers and biostimulants, are biologically derived products that enhance crop growth and soil health through natural processes. Their deployment is a key strategy for reducing nutritional dilution, the decline in nutrient density of crops associated with conventional farming. By improving soil biology and plant nutrient uptake, bio-inputs can increase concentrations of essential minerals and bioactive compounds in food, directly addressing this challenge [17] [50].
The table below defines the core categories of bio-inputs and their primary functions.
| Category | Definition | Primary Function | Key Organisms/Components |
|---|---|---|---|
| Biofertilizers [51] [52] [53] | Products containing living microorganisms that colonize the rhizosphere or plant interior. | Make nutrients more available to plants by fixing atmospheric nitrogen, solubilizing phosphorus, or mobilizing potassium. | Rhizobium, Azospirillum, Azotobacter, Mycorrhizal Fungi, Phosphate-Solubilizing Bacteria (PSB) |
| Biostimulants [52] [54] [55] | Natural substances or microorganisms that stimulate natural plant processes. | Enhance nutrient use efficiency, tolerance to abiotic stress, and crop quality, independently of their own nutrient content. | Seaweed extracts, humic acids, amino acids, plant extracts, beneficial microbes |
| Biopesticides [52] [56] | Derived from natural materials to control pests and diseases. | Manage specific pests with minimal toxicity to non-target organisms, reducing chemical residues. | Bacillus thuringiensis (Bt), Trichoderma, neem oil, pheromones |
Troubleshooting Common Experimental Challenges
This section addresses specific, high-frequency problems researchers encounter when working with bio-inputs in a lab or field trial setting.
FAQ 1: Why is the efficacy of my microbial biofertilizer inconsistent across experimental replicates or trial sites?
Inconsistent efficacy is one of the most significant challenges in bio-input research [57]. The table below outlines major causes and targeted solutions.
| Problem Cause | Explanation | Troubleshooting & Experimental Solutions |
|---|---|---|
| Poor Microbial Viability/Shelf Life [51] | Formulations degrade during storage; live cell count drops below the threshold for efficacy. High temperatures and UV exposure are major detrimental factors. | Protocol: Implement a viability tracking protocol. Perform serial dilution and plating at receipt, pre-application, and post-application to confirm Colony Forming Units (CFUs). Storage: Adhere strictly to storage conditions (often 4°C). Test new formulations with stabilizing agents like humic substances or specific carriers [51] [55]. |
| Non-Optimal Soil/Host Habitat [57] | The introduced microbial strain is outcompeted or cannot establish in the native soil microbiome, which may be bacteria-dominant and lack fungal pathways. | Pre-Testing: Before the main experiment, conduct a baseline soil analysis that includes microbial biomass (e.g., PLFA), organic carbon (POXC), and a 24-hour CO2 burst test to understand the biological starting point [55]. Habitat Management: Pre-treat soil with organic amendments (e.g., compost) to "build the house" for the introduced biology [57]. |
| Incompatible Co-Applications [55] | Tank-mixing with certain synthetic chemical fertilizers or pesticides can be toxic to the live microorganisms. | Compatibility Testing: Prior to field trials, conduct in vitro assays to test the compatibility of the biofertilizer with all other inputs in the experimental protocol. Observe for signs of inhibition or cell death. |
| Insufficient Inoculant Concentration [57] | The application rate may be too low to establish a meaningful population in a complex soil matrix. | Dose-Response Trials: Conduct initial dose-response experiments to establish a minimum effective concentration. As one farmer-researcher noted, a typical application rate can be like "putting a drop of water in a swimming pool" [57]. |
FAQ 2: How can I distinguish and validate the biostimulant mode of action from a fertilizer effect in my experimental design?
A core tenet of biostimulant definition is that they act independently of their nutrient content [54]. Failing to control for this can confound results.
- Challenge: A seaweed extract may contain significant amounts of potassium. Is the observed plant growth due to the potassium (fertilizer effect) or the bioactive hormones (biostimulant effect)?
- Experimental Protocol to Isolate Biostimulant Action:
- Nutrient Analysis: First, chemically analyze the biostimulant product to determine its exact macro- and micronutrient content.
- Control Groups: Establish multiple control groups in your experimental design:
- Negative Control: No treatment.
- Nutrient Control: A treatment that provides an equivalent amount of nutrients (e.g., a soluble potassium fertilizer) found in the biostimulant product.
- Biostimulant Treatment: The full biostimulant product.
- Response Metrics: Measure parameters that are classic markers of biostimulant action, such as:
- Chlorophyll fluorescence (Fv/Fm) as a measure of photosynthetic efficiency under abiotic stress.
- Antioxidant enzyme activity (e.g., catalase, peroxidase) in plant tissue under stress conditions.
- Gene expression of stress-responsive genes (e.g., those for heat-shock proteins, aquaporins).
- Validation: A true biostimulant effect is demonstrated when the biostimulant treatment group shows significantly better results in the metrics from step 3 than the nutrient control group, confirming the effect is not solely due to nutrition [17] [53].
FAQ 3: What are the critical regulatory considerations when designing experiments for product development?
In the United States, the classification of a bio-input is heavily dependent on its claimed mechanism and end use, governed by FIFRA.
- The Pesticide Trap: A product intended to "stimulate" plant growth through "physiological action" can be classified as a "plant regulator" under FIFRA, which legally defines it as a pesticide and requires EPA registration [54].
- Troubleshooting for Claim Substantiation:
- Problem: An experiment generates data leading to a claim like "root stimulator" or "accelerates growth rate," which triggers pesticide classification.
- Solution: Focus experimental design and subsequent claims on non-physiological effects. EPA guidance suggests claims related to "improving soil/seed nutrient conditions for root growth" are less likely to be considered pesticidal [54]. Frame results and claims around nutritional quality outcomes, such as "improves nutrient use efficiency" or "enhances zinc accumulation in grains," which aligns with the goals of reducing nutritional dilution and may fall outside the pesticide definition [17] [54].
Visualization of Microbial Action and Experimental Workflow
The following diagrams illustrate the functional pathways of key bio-inputs and a systematic workflow for troubleshooting experiments.
Bio-input Functional Pathways in Plants
Bio-Input Experiment Troubleshooting
The Scientist's Toolkit: Key Reagents and Materials
This table details essential materials and their functions for research on biofertilizers and biostimulants.
| Tool/Reagent | Function in Research | Application Notes |
|---|---|---|
| Stabilizing Carriers (e.g., peat, clay, alginate beads) [51] | Protects microbial cells in biofertilizer formulations during storage and application, extending shelf life. | Used in encapsulation and aggregated formulations. Test different carriers for compatibility with specific microbial strains. |
| Humic and Fulvic Acids [55] | Serves as a core component in many biostimulants; chelates nutrients, stimulates microbial activity, and enhances soil structure. | Used as a soil amendment or in liquid formulations. A key reagent for experiments on carbon-based biostimulants. |
| Seaweed Extract [53] [55] | A complex mixture of polysaccharides, hormones (auxins, cytokinins), and micronutrients. A standard biostimulant for stress tolerance trials. | Used in foliar sprays or soil applications. Critical for studying plant responses to abiotic stress. |
| PLFA Analysis (Phospholipid Fatty Acid) [57] [55] | A biochemical technique for profiling the entire soil microbial community (biomass and structure). | Used to establish a baseline soil biology and measure the impact of bio-inputs on the native microbiome. |
| Gibberellic Acid / Cytokinins [51] [54] | Plant growth hormones. Their presence in a product is a red flag for potential regulation as a pesticide (plant regulator) under FIFRA. | Essential reference standards for chemically characterizing biostimulant products and assessing regulatory status. |
| Selective Media Plates | Allows for the isolation and quantification of specific microbial strains (e.g., Rhizobium, Azospirillum) from a complex soil sample. | Used for tracking the survival and colonization of inoculated biofertilizer strains in the rhizosphere. |
Navigating Implementation Hurdles and Optimizing for Efficacy
Troubleshooting Guides
Why is the efficacy of my biological input varying between greenhouse and field trials?
Environmental factors in field settings, such as variable soil microbiota, abiotic stress (drought, temperature fluctuations), and nutrient competition, can lead to discrepancies versus controlled greenhouse environments.
Diagnostic Procedure:
- Compare Soil Physicochemistry: Test and compare pH, organic matter, and macronutrient levels (N, P, K) in both environments.
- Profile Microbial Communities: Use 16S rRNA sequencing for bacteria and ITS sequencing for fungi to identify differences in the native soil microbiome that may be antagonistic or competitive.
- Monitor Plant Physiology: Measure stomatal conductance and chlorophyll content (e.g., using a SPAD meter) in both trials to assess plant stress levels.
Resolution:
- If the issue is a competitive soil microbiome, consider a soil amendment or a different inoculation method to better establish the introduced biological.
- If the issue is abiotic stress, investigate and potentially apply a compatible stress-protectant formulation alongside the biological input.
My biological control agent is ineffective against the target pathogen in specific soils. What should I do?
The activity of biological control agents (BCAs), such as Trichoderma spp., can be suppressed by specific soil conditions or pre-existing microbial equilibria.
Diagnostic Procedure:
- Conduct In Vitro Antagonism Assays: Confirm the agent's efficacy against the pathogen in culture plates using soil extracts from the problematic field. This determines if the soil chemistry itself is inhibitory.
- Quantify BCA Survival: Use quantitative PCR (qPCR) with species-specific primers to track the population density and survival of the BCA in the rhizosphere over time.
Resolution:
- If the soil chemistry is inhibitory (e.g., extreme pH), explore soil amendment strategies to correct the pH or other factors.
- If the BCA fails to establish, switch to a different, more robust strain or a formulated product with carriers that enhance its shelf life and soil persistence.
Frequently Asked Questions (FAQs)
Q: What does "Variable Efficacy of Biological Inputs" mean? A: It refers to the inconsistent performance of biological products, like biostimulants or biofertilizers, when used in different geographic locations, soil types, or under varying climatic conditions. A product that works very well in one region might show minimal effects in another.
Q: How does this relate to reducing nutritional dilution in crops? A: Nutritional dilution occurs when crop yields increase, but the concentration of essential vitamins and minerals in the harvested food decreases. Effective biological inputs can enhance nutrient uptake and assimilation in plants. By ensuring these inputs work reliably across environments, we can promote the consistent production of high-yielding, nutrient-dense crops, thereby countering nutritional dilution.
Q: What are the most critical factors to document when reporting field trial results? A: For reproducibility and troubleshooting, always document:
- Full soil analysis (texture, pH, EC, organic matter, micronutrients).
- Local weather data (daily temperature, precipitation, humidity) throughout the trial period.
- Previous crop and field management history (e.g., herbicide and pesticide use).
- Exact product formulation details, including carrier and CFU count (if applicable).
- Method and timing of application.
Table 1: Efficacy Metrics of a Hypothetical Phosphate-Solubilizing Biofertilizer Across Three Soil Types
| Soil Type | pH | Available P (ppm) | Yield Increase vs. Control | Plant P Content Increase |
|---|---|---|---|---|
| Clay Loam | 6.5 | 15 | 15.2% | 18.5% |
| Sandy Loam | 7.2 | 32 | 8.7% | 10.1% |
| Silty Clay | 5.8 | 9 | 21.5% | 25.3% |
Table 2: Troubleshooting Common Formulation and Application Issues
| Problem | Potential Cause | Suggested Corrective Action |
|---|---|---|
| Low Cell Viability in Formulation | Unsuitable carrier, moisture content too high/low | Test alternative carriers (e.g., peat, clay), optimize drying process, add protective osmolytes. |
| Poor Root Colonization | Host-specific compatibility issues, high microbial competition | Screen different microbial strains for specific crops, use a higher initial inoculum density. |
| Rapid Die-Off Post-Application | Desiccation, UV radiation, soil predators | Reformulate with UV protectants, adjust application to early morning/evening, use encapsulation. |
Detailed Experimental Protocol: Assessing Biofertilizer Efficacy
Objective: To evaluate the impact of a novel phosphate-solubilizing bacterial inoculant on plant growth and phosphorus uptake in a controlled environment, simulating different soil pH conditions.
Materials:
- Seeds: A standard cultivar of spring wheat (Triticum aestivum).
- Biological Input: A lyophilized powder of the phosphate-solubilizing bacterium Pseudomonas fluorescens (strain XXX).
- Growth Substrate: A sterile, low-phosphorus sandy loam soil.
- Pots, growth chambers, watering system, and harvesting tools.
Methodology:
- Experimental Design: Set up a completely randomized design with 4 treatments and 10 replicates each:
- T1: Soil pH 6.0 + Biofertilizer
- T2: Soil pH 6.0 + Control (no biofertilizer)
- T3: Soil pH 7.5 + Biofertilizer
- T4: Soil pH 7.5 + Control (no biofertilizer)
- Soil Preparation and Inoculation: Adjust soil pH using calcium hydroxide (to raise pH) or elemental sulfur (to lower pH). Sterilize the soil by autoclaving. The biofertilizer is resuspended in sterile water and mixed thoroughly into the soil of the treatment pots at sowing according to the manufacturer's recommended rate. Control pots receive an equal volume of sterile water.
- Plant Growth and Maintenance: Sow five seeds per pot. Thin to three uniform seedlings per pot after emergence. Grow plants in a controlled environment chamber with a 16/8 hour light/dark cycle, 22°C day/18°C night temperature. Water uniformly to maintain soil moisture at 60% of water-holding capacity. Do not add any supplemental phosphorus fertilizer.
- Data Collection:
- Biomass: At 6 weeks post-emergence, harvest shoots and roots separately. Dry them in an oven at 70°C for 48 hours and record the dry weight.
- Phosphorus Content: Grind the dried shoot tissue to a fine powder. Digest the tissue in nitric acid and analyze the phosphorus concentration using an Inductively Coupled Plasma Optical Emission Spectrometer (ICP-OES).
The Scientist's Toolkit: Research Reagent Solutions
Table 3: Essential Materials for Investigating Biological Inputs
| Item | Function in Research |
|---|---|
| Selective Media | Allows for the isolation and enumeration of specific introduced microorganisms from complex environmental samples like soil. |
| Universal Primers for 16S/ITS rRNA | Used for PCR amplification and sequencing to characterize the total bacterial and fungal community composition in the soil. |
| Species-Specific qPCR Primers/Probes | Enables precise, quantitative tracking of the population dynamics of a specific applied biological agent in the rhizosphere. |
| Soil Nutrient Extraction Kits | Provides standardized methods for extracting and quantifying available nutrients (N, P, K) from soil samples. |
| Plant Tissue Digestion Tubes | Used for the acid digestion of plant tissue prior to elemental analysis via ICP-OES or similar instruments. |
| SPAD Meter | A non-destructive tool for quickly estimating leaf chlorophyll content, which serves as a proxy for plant nitrogen status and overall health. |
Signaling Pathways and Workflows
Biological Input Efficacy Pathway
Experiment Workflow
Technical Support Center: FAQs and Troubleshooting Guides
Frequently Asked Questions (FAQs)
Q1: What is the primary cause of "nutritional dilution" in modern crops? A: Nutritional dilution refers to the decline in the vitamin and mineral content of fruits, vegetables, and staple crops over the past several decades. This is primarily due to soil degradation and agricultural practices that prioritize high-yield varieties and rapid growth over nutrient density. Studies have shown declines of 25-50% in the nutrient density of many common fruits and vegetables over the past 50-70 years [15].
Q2: Which precision agriculture technologies are most effective for managing soil nutrient levels? A: In-ground sensors are highly effective for providing near-real-time information on soil properties such as moisture and nutrient levels. Additionally, remote sensing platforms (e.g., drones, ground robots) can provide valuable measurements on overall crop conditions, helping researchers and farmers make data-driven decisions to optimize nutrient application [58].
Q3: What are the significant challenges in adopting these technologies in research settings? A: Key challenges include [58]:
- High acquisition costs: The up-front cost for the latest technologies can be prohibitive.
- Data interoperability: A lack of uniform standards can hamper different technologies from working together seamlessly.
- Data ownership and sharing concerns: Uncertainties about farm data sharing and ownership can pose obstacles, particularly for AI-driven analysis.
Q4: How can research institutions encourage the adoption of technologies that mitigate nutrient decline? A: Policy options and strategies include [58]:
- Providing financial incentives through grants or modified eligibility for existing governmental programs.
- Promotion and outreach via expanded Extension services and on-field demonstrations.
- Encouraging further innovation by supporting R&D for improved data gathering and promoting the development of data standards.
Troubleshooting Common Experimental Issues
Issue: Inconsistent nutrient level readings from in-ground sensors.
- Potential Cause: Sensor calibration drift or improper placement in the soil profile.
- Solution: Implement a regular calibration schedule using standard solutions. Ensure sensors are installed at the correct depth and have good soil contact as per manufacturer guidelines. Check for and promote data standards to improve interoperability between devices [58].
Issue: Yield data from precision equipment does not correlate with lab-analysis of crop nutrient density.
- Potential Cause: The "dilution effect," where higher yields may lead to lower concentrations of certain minerals in the harvested tissue [15].
- Solution: Do not rely on yield as a sole proxy for nutritional quality. Design experiments that directly measure the nutrient content (e.g., via lab analysis) of the edible portions of the crop, especially when trialing traditional or biofortified varieties [15].
Issue: Resistance from farm collaborators to implement experimental protocols for nutrient-density studies.
- Potential Cause: Perceived complexity, risk to income, or lack of immediate benefit. Adoption studies show that factors like farm size, access to education, and land tenure security significantly influence a farmer's willingness to adopt new practices [59].
- Solution: Provide clear communication on the purpose and benefits. Offer comprehensive technical support and, if possible, financial incentives to offset perceived risks [59] [58].
Summarized Quantitative Data on Nutrient Decline
Table 1: Documented Decline in Nutrient Content of Broccoli (1975-1997) [15]
| Nutrient | Percentage Decline |
|---|---|
| Calcium (Ca) | 56% |
| Vitamin A | 38.3% |
| Iron (Fe) | 20% |
| Vitamin C | 17.5% |
Table 2: Key Factors Influencing Agricultural Technology Adoption [59]
| Factor | Average Correlation with Adoption | Notes & Context |
|---|---|---|
| Farmer Education | Positive | For improved varieties, access to extension services can substitute for formal education. |
| Farm Size (Land) | Positive | Larger farms are more likely to adopt improved crop varieties and chemical inputs. |
| Land Tenure Security | Positive | Strongly encourages adoption of sustainable land management practices with long-term benefits. |
| Access to Credit | Positive | Measuring whether farmers are credit-constrained is more important than simple access. |
| Extension Services | Positive | Complements formal education for natural resource management technologies. |
Experimental Protocol: Assessing Nutrient Density in Crops
Objective: To evaluate and compare the mineral content of modern and traditional crop varieties grown under identical conditions.
3.1. Materials and Reagent Solutions
Table 3: Research Reagent Solutions and Essential Materials
| Item | Function/Brief Explanation |
|---|---|
| Inductively Coupled Plasma Mass Spectrometry (ICP-MS) | Highly sensitive analytical technique for quantifying trace elements and minerals in plant tissue samples. |
| Freeze Dryer | Removes water from plant samples through sublimation, preserving nutrient integrity and providing a stable dry weight for analysis. |
| Micronutrient Standard Solutions | Certified reference materials used to calibrate the ICP-MS, ensuring accurate quantification of specific minerals. |
| Nitric Acid (TraceMetal Grade) | Used in the digestion process to completely break down organic matter in plant samples into a liquid solution for analysis. |
| Traditional/Heritage Seed Varieties | Seeds of non-commercial, traditional crops (e.g., pearl millet, sorghum) known anecdotally or historically for higher nutrient density [15]. |
| Modern High-Yield Seed Varieties | Seeds of commonly cultivated commercial crops for comparison. |
| In-Ground Soil Sensors | Monitor real-time soil moisture, temperature, and nutrient levels to standardize and document growing conditions across experimental plots [58]. |
3.2. Methodology
- Experimental Design: Establish a randomized complete block design with a minimum of four replicates for each crop variety (traditional vs. modern).
- Cultivation: Grow all varieties in the same controlled environment or field plot. Use in-ground sensors to monitor and ensure uniform soil conditions (moisture, NPK levels) across all plots [58]. Do not use fertilizer beyond baseline levels to prevent nutrient masking.
- Sample Harvesting: At maturity, harvest the edible portion of the crop (e.g., grain, fruit). Wash with deionized water to remove soil contaminants.
- Sample Preparation: Lyophilize (freeze-dry) a representative sub-sample of each replicate. Grind the dried tissue to a fine, homogeneous powder.
- Acid Digestion: Accurately weigh ~0.2g of powdered plant material into digestion tubes. Add 5 mL of concentrated trace-metal grade nitric acid. Digest using a microwave-assisted digestion system following a stepped temperature program. Cool and dilute the digestate to a known volume with deionized water.
- ICP-MS Analysis: Analyze the digested solutions using ICP-MS. Quantify key minerals (e.g., Iron, Zinc, Calcium, Magnesium) using external calibration curves prepared from micronutrient standard solutions. Include quality control samples (blanks, certified reference materials) with each batch.
- Data Analysis: Express results on a dry weight basis (e.g., micrograms per gram). Perform statistical analysis (e.g., ANOVA) to determine significant differences in mineral content between traditional and modern varieties.
Workflow and System Relationship Diagrams
Technology Adoption Flow
Research Feedback Loop
Economic and Infrastructural Barriers for Widespread Implementation
Troubleshooting Guide: FAQs on Implementation Barriers
This section addresses common questions researchers encounter when designing and implementing strategies to combat nutrient dilution.
FAQ 1: What are the primary economic barriers preventing farmers from adopting precision nutrient management? The adoption of advanced nutrient management is primarily hindered by high upfront costs and unclear return on investment (ROI). Farmers often cannot justify the initial investment in technology without precise, proven data on profitability [60]. Furthermore, limited access to credit and financing is a significant hurdle, especially for smallholder farmers, as government subsidies or private funding initiatives are often insufficient or difficult to access [60].
FAQ 2: Which infrastructural gaps most significantly limit the effectiveness of digital agriculture solutions? The effectiveness of digital agriculture is severely limited by inadequate digital infrastructure in rural areas. The lack of reliable high-speed internet and mobile connectivity prevents farmers from using cloud-based solutions, real-time data, and other AgTech tools that depend on connectivity [60] [61]. This is compounded by technology complexity and usability issues, where solutions require specialized knowledge that discourages adoption [60].
FAQ 3: How does the perception of economic risk influence the transition to sustainable practices? The perception of economic risk is a critical barrier. Farmers may view practices like cover cropping or organic farming as risky investments due to initial costs and potential yield variations during the transition period [62] [63]. This is exacerbated by a lack of resources and localized information for implementation, making it difficult for farmers to strategize effectively [63].
FAQ 4: What role do policy and regulatory frameworks play in either hindering or promoting adoption? Inconsistent government policies and regulatory uncertainty can hinder the large-scale adoption of agricultural technology [60]. Stakeholders report that financial support, clear policy changes, and capacity-building efforts are essential to make Climate-Smart Agriculture practices attractive to farmers [64]. Improved coordination among stakeholders and incentives for sustainable practices are also crucial [64].
FAQ 5: From a researcher's perspective, what are the key challenges in scaling nutrient management strategies from experimental plots to widespread use? Key challenges include the significant variability in critical nutrient dilution curves across different genotypes, environments, and management practices (G×E×M interactions) [65]. This makes it difficult to develop universal models. Furthermore, there is a scarcity of high-quality data from multiple site-years and fertilization levels, which is essential to establish reliable and generic diagnostic tools, but is often restricted by high costs [65].
Diagnostic Data Tables for Implementation Barriers
Table 1: Quantitative Profile of Major Economic Barriers
This table summarizes key economic hurdles as identified in recent agricultural studies.
| Barrier Category | Specific Challenge | Supporting Data / Prevalence |
|---|---|---|
| High Initial Investment | Upfront cost of precision agriculture tech and sustainable inputs | 56% of emerging-market farmers cited high upfront costs as the primary reason for non-adoption [60]. |
| Unclear ROI | Uncertainty regarding profitability and yield benefits | Farmers often take a "wait-and-see" approach due to a lack of proven, localized data on economic payoff [60]. |
| Limited Financing | Lack of access to credit and subsidies for smallholders | AgTech adoption remains low in developing regions where financial resources are constrained [60]. |
| Transition Costs | Economic risks and potential yield dips during shift to new practices | Organic farmers face uncertainties during transition without guaranteed premium prices [62]. |
| Certification Costs | Financial burden of organic or sustainability certification | Identified as a common challenge for organic farmers, requiring financial aid [62]. |
Table 2: Infrastructure and Technology Adoption Gaps
This table outlines critical infrastructural and technological limitations that impede the implementation of advanced agricultural research.
| Gap Category | Specific Limitation | Impact on Implementation |
|---|---|---|
| Digital Infrastructure | Lack of reliable high-speed internet in rural areas | Renders cloud-based solutions and real-time data tools ineffective [60] [61]. |
| Technological Usability | Complexity of new AgTech solutions; requires specialized knowledge | Discourages adoption by farmers who may feel overwhelmed [60]. |
| Data Scarcity | Insufficient site-year data for robust model development | Hampers the creation of universal critical nutrient curves applicable across diverse G×E×M scenarios [65]. |
| Land Tenure Issues | Lack of secure land rights | Creates reluctance to invest in long-term agricultural technologies [60]. |
Experimental Protocols for Barrier Analysis
Protocol 1: Assessing Economic Viability and Farmer Perception
Objective: To quantitatively evaluate the economic barriers and psychosocial drivers influencing the adoption of a specific nutrient management practice (e.g., site-specific nutrient management or organic amendments).
Methodology:
- Survey Design: Develop a structured questionnaire incorporating Likert scales to measure:
- Perceptions of Economic Sustainability: e.g., expected impact on income, production costs, and market acceptance [62].
- Perceived Barriers: e.g., high initial costs, complexity, and lack of technical support [62] [60].
- Demographic & Farm Characteristics: age, education level, farm size, land ownership, and previous training [62].
- Sampling: Employ stratified random sampling to ensure representation of different farm sizes and socio-economic backgrounds. A sample size of 400 farmers, as used in a similar study, provides robust data [62].
- Data Analysis:
- Use statistical software (e.g., SPSS) for analysis.
- Perform a binomial logit regression analysis to identify which factors (demographic, perception-based) are significant predictors of adoption willingness [62].
- Conduct qualitative analysis on open-ended responses to identify the most common challenges and requested support mechanisms.
Protocol 2: Field Validation of Critical Nutrient Dilution Curves
Objective: To determine the stability and domain of applicability of a critical phosphorus (P) dilution curve for a target crop (e.g., maize) under varying environmental and management conditions, addressing a key research scalability barrier.
Methodology:
- Experimental Design: Establish field trials across a minimum of 8-10 site-years to capture G×E×M variability [65]. At each site, implement a randomized complete block design with at least four graded levels of P fertilization (from deficient to supra-optimal).
- Biomass and Nutrient Sampling: At multiple key growth stages (e.g., V6, V12, VT, and R2 for maize), destructively sample above-ground plant biomass from a defined area.
- Shoot Biomass: Fresh weight should be recorded immediately, followed by oven-drying at 70°C to constant weight for dry matter (DM) determination.
- Nutrient Concentration: The dried plant tissue should be ground and analyzed for P concentration using standard methods like inductively coupled plasma optical emission spectrometry (ICP-OES) or colorimetric analysis after digestion.
- Data Analysis and Curve Fitting:
- For each sampling, plot the P concentration against the shoot biomass.
- Identify the critical points (where biomass is maximized for a given nutrient level).
- Fit the critical points to a power function: Pc = a * W^b, where Pc is the critical P concentration, W is the shoot biomass, and a and b are parameters.
- Advanced Statistical Fitting: Employ a Bayesian method to quantify the uncertainty associated with the critical dilution curve and to assess its stability across the different site-years [65].
- Calculation of Nutrition Index: Calculate the P Nutrition Index (PNI) as PNI = Pmeasured / Pcritical. Correlate the PNI values with the relative yield (yield at a given P rate / maximum yield observed) to validate the diagnostic power of the curve.
Workflow and Relationship Diagrams
Diagram 1: Research-to-Impact Pathway
Diagram 2: Multi-Nutrient Diagnosis Logic
The Scientist's Toolkit: Research Reagent Solutions
Table 3: Key Reagents and Materials for Nutrient Dilution Research
| Item | Function / Application in Research |
|---|---|
| Dilution Curve Model Parameters (a & b) | The species-specific parameters for the power function (Nutrient_c = a * Biomass^b) used to model the critical nutrient dilution curve and diagnose crop nutritional status [65]. |
| Inductively Coupled Plasma Optical Emission Spectrometry (ICP-OES) | An analytical technique used for the precise and simultaneous quantification of multiple nutrient elements (e.g., P, K, S) in digested plant tissue samples [65]. |
| Forced-Air Drying Oven | Used to dry fresh plant biomass samples at a consistent temperature (e.g., 70°C) to determine dry matter weight, a fundamental variable in dilution curve analysis [65]. |
| Bayesian Statistical Software (e.g., R/Stan) | Advanced statistical tools used to fit critical dilution curves and, crucially, to quantify the uncertainty and stability of these curves across diverse G×E×M interactions [65]. |
| Soil and Plant Analysis Development (SPAD) Meter / NDVI Sensors | Proximal sensing tools that allow for non-destructive, high-frequency estimation of crop nitrogen status and biomass, useful for temporal monitoring and model validation [1]. |
Optimizing Protocols for Hydroponic and Controlled-Environment Agriculture
Technical Support Center: Troubleshooting Guides and FAQs
Frequently Asked Questions (FAQs)
What is the most common problem in hydroponic systems and how can it be identified? The most common problem is pH fluctuation leading to nutrient lockout, where plants cannot absorb nutrients even if they are present in the solution. This can be identified when plants show deficiency symptoms like yellowing leaves despite a properly mixed nutrient solution. Daily pH monitoring is the best preventive measure [66].
Why are my hydroponic leaves turning yellow? Yellowing leaves can indicate a true nutrient deficiency or a nutrient lockout caused by incorrect pH [66]. Diagnose by first checking the pH level of your nutrient solution. Then, verify the Electrical Conductivity (EC) to assess nutrient concentration. Correct the nutrient mix based on your specific crop and growth stage [66].
How can I prevent algae growth in my system? Algae growth can be prevented by thoroughly light-proofing all reservoirs, channels, and net pots. Maintain stable nutrient solution temperatures and adhere to a regular system cleaning and solution refresh schedule [66].
What are the signs of root rot and how can it be fixed? Root rot presents as brown, mushy roots with a foul smell. The quick fix involves chilling the nutrient solution to below 75°F (24°C), increasing aeration, rinsing the roots to remove slime, and refreshing the solution [66].
How often should I check pH and EC/PPM levels? For stable systems, check pH daily and EC every few days. Monitor both more frequently if you notice rapid plant changes or are running a new setup [66].
Troubleshooting Common Issues
Symptom: Yellowing Older Leaves
- Potential Cause: Nitrogen deficiency [66].
- Solution: Verify pH is in the optimal range (typically 5.5-6.5). Check EC; if too low, adjust nutrient concentration. Ensure a complete hydroponic nutrient formula is being used [66].
Symptom: Yellowing Younger Leaves
- Potential Cause: Iron deficiency [66].
- Solution: Check and adjust pH, as iron becomes less available at higher pH levels. Verify that your nutrient solution contains sufficient chelated iron [67].
Symptom: Brown or Black Mushy Roots with Bad Smell
- Potential Cause: Root rot (often Pythium) [66] [67].
- Solution: Increase dissolved oxygen by adding air stones. Reduce solution temperature. Consider using beneficial microorganisms to outcompete pathogens. In severe cases, use a registered sanitizing agent [66].
Symptom: White or Cream-colored Roots with No Smell
- Status: This indicates healthy roots and optimal root zone conditions [66].
Symptom: Stunted Growth, Pale Leaves
- Potential Cause: Nutrient lockout due to improper pH [68].
- Solution: Measure pH daily and adjust using pH Up/Down solutions to the crop-specific target range. The ideal pH for most hydroponic nutrient solutions is around 5.6 [68].
Quantifying Nutritional Dilution: A Research Context
Nutritional dilution refers to the systematic decrease in the concentration of essential micronutrients in food crops over recent decades. The following table summarizes documented declines in mineral content, underscoring the critical need for optimized agricultural protocols to combat this trend [3].
Table 1: Documented Decline in Mineral Content of Fruits and Vegetables Over Time
| Mineral | Decline Over Specified Period | Timeframe | Reference |
|---|---|---|---|
| Copper | Up to 81% in vegetables | 1936 - 1991 | [3] |
| Iron | 50% in various foods | 1940 - 2019 | [3] |
| Calcium | 19% in vegetables | 1936 - 1991 | [3] |
| Magnesium | 35% in vegetables | 1936 - 1991 | [3] |
| Sodium | 52% in various foods | 1940 - 2019 | [3] |
| Iron (in specific vegetables) | 51-88% (e.g., Watercress 88.2%, Collard greens 81%) | 1975 - 1997 | [3] |
Table 2: Decline in Vitamin Content (1975 - 1997)
| Vitamin | Example Decline | Crop Example |
|---|---|---|
| Vitamin A | 38-68% | Cauliflower (68.3%), Broccoli (38.3%) [3] |
| Vitamin C | Up to 30% | Various fruits and vegetables [3] |
Experimental Protocols for Mitigating Nutritional Dilution
Protocol 1: Continuous Cultivation for Optimal Biomass Composition
This protocol is adapted from studies on Spirulina cultivation and demonstrates how dilution rate and nutrient concentration can be manipulated to achieve desired biomass composition, a key principle in addressing nutritional dilution [69].
Objective: To determine the optimal dilution rate in a continuous cultivation system that maximizes biomass productivity and nutrient removal efficiency, while controlling macromolecular composition (e.g., protein vs. carbohydrate content).
Methodology:
- System Setup: Use a continuous cultivation bioreactor (e.g., a chemostat). The key culture medium is Recirculating Aquaculture System (RAS) wastewater or a synthetically replicated version, with two primary nitrate concentrations (e.g., 50 mg N/L and 80 mg N/L) [69].
- Inoculation: Inoculate with the target microorganism (e.g., Spirulina platensis) at an initial biomass concentration of 0.10 g DW/L [69].
- Environmental Control: Maintain constant temperature, pH (e.g., 8.5-9.5 for Spirulina), and light intensity via LED panels. Provide aeration for mixing and CO₂ exchange [69].
- Experimental Treatment: Apply multiple dilution rates (D). For example, test D = 0.20, 0.25, 0.35, and 0.50 per day. The dilution rate controls the rate at which fresh medium is added and spent medium/cells are removed [69].
- Data Collection:
Diagram: Continuous Cultivation Workflow
Protocol 2: System Diagnostics and Nutrient Management
Objective: To systematically diagnose and correct common nutrient-related pathologies in hydroponic systems, ensuring optimal nutrient uptake and minimizing dilution effects in edible tissues.
Methodology:
- Visual Inspection: Weekly, photograph plants and conduct a 2-minute system health scan: check leaf color and condition, inspect root color and firmness, scan for algae, and verify all equipment is operational [66].
- Quantitative Measurement:
- Root Zone Management: Monitor solution temperature (ideal <75°F or 24°C) and ensure continuous, vigorous aeration to prevent root diseases [66].
- Solution Maintenance: Completely replace the nutrient solution every two weeks to prevent the buildup of root exudates and nutrient imbalances [70].
Signaling Pathways and Logical Workflows
Diagram: Nutritional Dilution Cause & Effect
The Scientist's Toolkit: Research Reagent Solutions
Table 3: Essential Materials for Hydroponic and CEA Research
| Item | Function / Explanation |
|---|---|
| pH & EC Meters | Critical for monitoring acidity/alkalinity (pH) and nutrient concentration (EC). pH must be maintained between 5.5-6.5 for optimal nutrient availability [66] [70]. |
| Complete Hydroponic Nutrient Solution | A balanced mixture of all essential macro and micronutrients. Using a solution designed for specific crop stages is vital to prevent deficiencies and dilution [66] [3]. |
| Inert Growing Media (e.g., Rockwool, Coconut Coir) | Provides physical root support and moisture retention without altering the chemistry of the nutrient solution, allowing for precise experimental control [71]. |
| Water Treatment System (e.g., Reverse Osmosis) | Provides a consistent, clean water source by removing minerals and contaminants from tap water, which can skew EC readings and nutrient balance [66] [67]. |
| Beneficial Microorganisms | Used as a biocontrol agent to outcompete root pathogens and can enhance nutrient cycling and uptake, contributing to plant health and nutrient density [3] [67]. |
| Hydroponic System Sanitizers | Essential for maintaining aseptic conditions and preventing algal and bacterial blooms that compete with plants for nutrients and oxygen [66]. |
| Automated Dosing & Data Logging Systems | Technology like the HydroDirector module allows for precise regulation of nutrients and real-time monitoring of water parameters, ensuring consistent experimental conditions [70]. |
Monitoring and Adaptive Management Using Real-Time Soil and Crop Data
Troubleshooting Guides
Soil Moisture Sensor Diagnostic Guide
Table: Common Soil Moisture Sensor Issues and Resolutions
| Observed Problem | Potential Causes | Diagnostic Steps | Corrective Actions |
|---|---|---|---|
| Constant '0' (Saturated) Reading [72] | Electrical short in sensor wiring [72] | Disconnect sensor from cable extensions; check if reading remains "0" [72] | Repair or replace faulty wiring; ensure all connections are waterproof [72] |
| Persistently High/Dry Reading [72] | Broken/poor wire connection; sensor poorly bonded to soil [72] | Inspect all wire splices for damage; check sensor responsiveness to irrigation [72] | Secure all connections; reinstall sensor to ensure tight contact with soil [72] |
| Erratic/Unstable Readings [72] | Poor electrical connections; stray current from ungrounded equipment [72] | Check all wire splices and connection points for integrity [72] | Solidify and waterproof all connections; ground reading equipment properly [72] |
| Unresponsive to Soil Wetting [72] | Poor installation creating air pockets; sensor placed outside active root zone [72] | Verify sensor location is in active root zone; perform water pour test [72] | Reinstall sensor using slurry in difficult soils to ensure full soil contact [72] |
| Inaccurate VWC in Air [73] | Sensor malfunction or calibration drift | Perform primary test: sensor in air should read between -5% and -50% VWC [73] | Follow manufacturer calibration procedures, especially for saline, sandy, or organic soils [73] |
Sensor Performance Verification Protocol
A systematic methodology to validate sensor functionality and ensure data reliability for nutritional density research.
Procedure:
- Initial Soak Test: Submerge the sensor in water. A functional sensor should read between 0 and 5 centibars within minutes [72].
- Air Dry Test: Let the sensor air dry for 30-48 hours. The reading should progressively increase to 150+ centibars [72].
- Re-soak Verification: Return the sensor to water. The reading should fall back to below 5 centibars within 2 minutes, confirming proper response [72].
- In-field Pour Test (for installed sensors): Pour water down the access pipe. The sensor reading should drop to saturated levels (<10 cb) rapidly [72].
Agri-Camera and Telemetry Diagnostics
Table: Common Image and Data Transmission Issues
| Problem | Diagnosis | Solution |
|---|---|---|
| Camera fails to power on [74] | Depleted battery; faulty solar panel | Charge manually; ensure solar panel is unobstructed and clean [74] |
| No data/imagery received [74] [75] | Poor cellular connectivity; device not registered | Verify device is online via platform; check SIM card status [74] [75] |
| Poor image quality | Obstructed lens; incorrect placement | Clean lens; reposition based on agronomic recommendations for optimal field view [74] |
Frequently Asked Questions (FAQs)
Hardware and Sensor Management
Q1: What is the typical operational lifespan of a soil moisture sensor, and when should it be replaced? The expected functional life is 5+ years. After five years, it is recommended to remove the sensors and perform the soak/air-dry verification test. Sensors in high-salinity environments may require more frequent checks or earlier replacement [72].
Q2: How should I prepare and install a new soil moisture sensor to ensure optimal performance? For best initial response, soak the sensor overnight in irrigation water. Always "plant" a wet sensor. Create an access hole to the desired depth, fill it with water, and push the sensor down so it bottoms out, ensuring a snug fit for proper soil contact [72].
Q3: How many crop monitoring cameras are needed per field to obtain representative data? In most cases, one sensor is sufficient for a field of up to 40 hectares. Cropler, for instance, provides a set of two cameras to monitor and compare different fields or zones simultaneously. The optimal placement is determined by analyzing field data to identify the most indicative locations [74].
Q4: How does soil temperature affect soil moisture readings? Soil temperature affects the WATERMARK sensor readings by approximately 1% of the measured resistance per 1°F change. For accurate data, especially at shallow depths, use reading equipment with temperature compensation, with the temperature sensor located near the moisture sensors [72].
Data Interpretation and Integration
Q5: At what soil moisture tension (centibar) should I trigger irrigation for my specific crop? While exact values are crop and soil-specific, general guidelines are:
- 30-60 cb: Usual irrigation range for most soils [72].
- 60-100 cb: Recommended range for initiating irrigation in heavy clay soils [72].
- 100-200 cb: Soil is becoming dangerously dry; proceed with caution to avoid yield loss [72].
Q6: How can I access the raw data from my field sensors for advanced analysis? Platforms like Cropler provide access to a web platform where you can download all field data, including images and sensor readings such as RGB & NDVI photos, air temperature, humidity, and plant growth dynamics [74]. The CropX platform also allows for data integration and export for reporting and analysis [75].
Q7: My sensor data does not match my visual assessment of the crop. Should I trust the sensor? Often, the sensor is accurate. First, check if multiple sensors in the field correlate. If the sensors are responsive to irrigation and drying cycles, the data is likely reliable. If unresponsive, the sensor may need reinstallation to ensure proper soil contact [72].
System and Platform Management
Q8: Can I integrate different brands of sensors and data sources into a single management platform? Yes, modern agronomy platforms like CropX are designed as one-stop-shops, capable of connecting data from various sources, including third-party IoT sensors, satellite imagery, and farm machinery, into one unified platform for holistic management [75].
Q9: What are the key steps in establishing an adaptive management plan for a long-term research project? A robust plan involves a cyclical process: 1) Define clear goals (e.g., improve soil health); 2) Conduct a baseline assessment; 3) Identify key monitoring indicators (e.g., soil carbon); 4) Implement strategies; 5) Monitor and evaluate; 6) Adapt and adjust strategies based on results [76].
Research Reagent Solutions & Essential Materials
Table: Key Materials for Real-Time Monitoring and Nutritional Research
| Item / Reagent | Primary Function | Application Context |
|---|---|---|
| Granular Matrix Sensor (e.g., WATERMARK) [72] | Measures soil water tension (centibars) in the root zone. | Precisely schedules irrigation to avoid plant stress that can exacerbate nutrient dilution. |
| Volumetric Soil Moisture Sensor [73] | Measures volumetric water content (VWC %) in soil. | Provides direct measurement of water volume available to plants for growth and nutrient uptake studies. |
| Soil Electroconductivity (EC) Sensor [75] | Measures soil salinity levels. | Critical for monitoring salt stress, which impacts plant health and nutrient concentration. |
| Agri-Cameras (RGB & NDVI) [74] | Captures real-time visual and spectral imagery of crop canopy. | Tracks crop health, biomass, and phenological stages non-destructively. |
| In-field Telemetry Device [75] | Provides cellular connectivity for data transmission from sensors to the cloud. | Enables real-time data access for immediate adaptive management decisions. |
| Anti-freeze Solution (Methanol) [72] | Prevents gauge damage in analog instruments during freezing conditions. | Protects equipment for year-round monitoring in temperate climates. |
Experimental Workflow for Adaptive Management
The following diagram illustrates the continuous cycle of data collection, analysis, and intervention that forms the core of an adaptive management strategy aimed at combating nutrient dilution.
Data Integration for Nutritional Insight
This diagram maps the logical flow of how disparate data sources are synthesized to generate actionable insights for improving crop nutritional quality.
Measuring Success: Efficacy, Trade-offs, and Future Directions
Frequently Asked Questions (FAQs) and Troubleshooting Guides
Soil Health and Nutrient Management
Q1: How can I accurately diagnose multi-nutrient co-limitations in my field trials?
Diagnosing co-limitations requires moving beyond single-nutrient analysis. Implement the critical nutrient dilution curve framework to understand interactions between nitrogen (N), phosphorus (P), potassium (K), and sulfur (S).
Recommended Protocol:
- Collect shoot biomass samples at multiple growth stages during vegetative development.
- Analyze for concentrations of N, P, K, and S.
- Calculate Nutrition Indices (NI) by dividing the measured nutrient concentration by the predicted critical concentration from established dilution curves [65].
- A Nutrition Index below 1 indicates deficiency for that specific nutrient.
Troubleshooting: If your calculated Nutrition Indices for multiple nutrients are below 1, you have a co-limitation. The strong interaction between nutrients, particularly the influence of N status on P, K, and S critical curves, means addressing a single deficiency in isolation may not yield optimal results [65]. An integrated nutrient management (INM) approach is required.
Q2: Why are my crop nutrient concentrations declining despite adequate fertilization?
This is a classic symptom of nutritional dilution, where increasing shoot biomass outpaces nutrient accumulation. This is a natural process as the plant ages, but it can be exacerbated by management practices [65].
- Troubleshooting Steps:
- Verify Application Timing: Nutrient availability must be synchronized with critical crop growth stages. Use site-specific nutrient management (SSNM) to ensure optimal availability when the crop needs it most [1].
- Check for Imbalances: The crop N status has been shown to affect the critical curves of P, K, and S. An N deficiency can limit overall growth and biomass production, thereby affecting the dilution dynamics of other nutrients [65].
- Assess Soil Health: Implement practices like cover cropping and organic amendments (e.g., farmyard manure) to improve soil structure and water-holding capacity, which enhances nutrient retention and availability [1].
Genetic Engineering Approaches
Q3: My genetically modified crop shows stunted growth instead of enhanced resilience. What could be wrong?
A common pitfall is disrupting delicate hormonal balances. Broad manipulation of hormone pathways, like brassinosteroids, can have unintended side effects if not done with cellular precision [77].
- Troubleshooting Guide:
- Problem: Global overexpression of a hormone-related gene.
- Solution: Shift to precision genetic engineering. Utilize single-cell transcriptomics and spatial imaging technologies to understand and manipulate gene expression with cell-type-specificity [77]. The goal is to make subtle, surgical tweaks to a plant's own gene expression patterns without side effects to the rest of the plant.
- Experimental Workflow: For enhancing drought tolerance, the target should not be blanket overexpression of a drought-response gene, but rather precision engineering to promote deeper root growth specifically in the root meristem [77].
Q4: What is the most precise method for developing crops resistant to nutritional dilution?
CRISPR-Cas9 genome editing is revolutionizing this field by allowing for precise modifications without introducing foreign genes [78].
- Protocol Overview:
- Identify Target Genes: Focus on genes controlling nutrient uptake, translocation, and remobilization within the plant.
- Design gRNA: Create guide RNA (gRNA) sequences that target the identified genes with high specificity.
- Delivery: Use Agrobacterium tumefaciens or gene gun methods to introduce the CRISPR-Cas9 construct into plant cells [78].
- Regeneration and Selection: Regenerate whole plants from transformed cells and perform genetic analysis to confirm the desired edits [78]. This method facilitates the development of crops with enhanced nutrient use efficiency, directly combating nutritional dilution.
Precision Agriculture Technologies
Q5: My satellite-derived crop health maps do not correlate with end-of-season yield. What is the issue?
This discrepancy often arises from a lack of temporal resolution and ground-truthing. A single snapshot is insufficient for analyzing dynamic processes like nutrient dilution.
- Troubleshooting Protocol:
- Increase Temporal Frequency: Utilize satellite services (e.g., Farmonaut, USDA CDL) that provide frequent, multi-spectral imagery throughout the entire growing season, not just at a single point [79] [80].
- Ground-Truthing: Correlate remote sensing data with in-field measurements. Collect biomass and tissue samples from areas identified as both healthy and stressed by the satellite imagery to validate nutrient status [80].
- Integrate Soil Sensor Data: Combine satellite data with real-time input from IoT soil sensors that track moisture and nutrient availability. This creates a more complete picture of the soil-plant system [79].
Q6: How can I use precision tools to implement variable-rate nutrient applications to combat dilution?
The goal is to apply the right source, at the right rate, time, and place (the 4Rs of nutrient stewardship) [1].
- Step-by-Step Methodology:
- Create a Baseline Map: Use historical yield maps and soil electroconductivity surveys to define management zones.
- Monitor In-Season: Employ drones with multispectral cameras or high-resolution (e.g., 10-meter) satellite data to identify zones of crop stress or varying biomass [79] [80].
- Prescribe Application Rates: Translate this data into a variable-rate prescription map for your fertilizer applicator. This allows you to apply more nutrients in high-yield potential areas and less in low-yielding areas, optimizing overall nutrient use efficiency (NUE) and reducing wasteful applications that can exacerbate environmental problems [1] [79].
Quantitative Data Comparison of Agricultural Strategies
Table 1: Impact and Efficacy of Different Strategies
This table summarizes the quantitative potential of each approach to improve yield and resource use efficiency, key factors in mitigating nutritional dilution.
| Strategy | Typical Yield Improvement | Nutrient Use Efficiency (NUE) Gain | Key Mitigation Mechanism against Nutritional Dilution |
|---|---|---|---|
| Precision Agriculture [79] [81] | 10-20% | High (30%+ water savings, reduced fertilizer waste) | Optimizes nutrient application to match crop demand in real-time, preventing excess biomass growth without proportional nutrient uptake. |
| Genetic Approaches [82] [79] | Up to 25% | Moderate to High (Built-in efficiency) | Enhances plant's innate ability to acquire and utilize nutrients efficiently, even under stress, and can alter plant architecture (e.g., root depth). |
| Soil Health & INM [1] | 8-150% (vs. conventional) | High (Reduces N losses by 12-30%) | Improves soil structure and biology, enhancing nutrient retention and availability in the rhizosphere, which supports steady nutrient supply to the plant. |
| Integrated Approach (Synergy) | >25% (Projected) | Very High | Combines the strengths of all approaches for a system-level solution. |
Table 2: The Scientist's Toolkit: Essential Research Reagents and Materials
| Item | Function in Experiment | Example Application |
|---|---|---|
| Single-Cell Transcriptomics Kit | Measures gene expression across many individual cells simultaneously. | Identifying cell-type-specific promoters for precision genetic engineering of root architecture [77]. |
| Multispectral Satellite Imagery / Drones | Provides real-time, geo-referenced data on crop health and biomass. | Creating base maps for variable-rate application and monitoring in-season biomass development to model dilution [79] [80]. |
| IoT Soil Sensors | Continuously monitors soil moisture, temperature, and nutrient (NPK) levels. | Ground-truthing remote sensing data and informing precision irrigation and fertilization schedules [79]. |
| CRISPR-Cas9 Reagents | Enables precise genome editing without introducing foreign genes. | Developing non-transgenic crops with enhanced nutrient uptake or utilization traits to combat dilution [78]. |
| Controlled-Release Fertilizers | Slow- or controlled-release fertilizer formulations. | Used in experiments to ensure a steady supply of nutrients to the plant, synchronizing with crop demand and reducing losses [1]. |
Experimental Protocols and Workflows
Protocol 1: Establishing a Critical Nutrient Dilution Curve
Objective: To develop a crop-specific model that defines the minimum nutrient concentration required for maximum shoot growth at any given biomass level [65].
Materials: Field plots, fertilizer gradients, equipment for destructive plant sampling, drying ovens, analytical scales, nutrient analysis equipment (e.g., ICP-MS for P, K, S).
Methodology:
- Experimental Design: Establish field trials with at least 4 gradients of the nutrient of interest (e.g., P fertilization rates) across a minimum of 8 site-years to account for environmental variability [65].
- Sampling: Conduct repeated destructive sampling of above-ground shoot biomass at multiple stages during the vegetative growth period.
- Analysis:
- Oven-dry and weigh samples to determine shoot biomass (t/ha or g/m²).
- Chemically analyze the tissue samples to determine nutrient concentration (e.g., % P, K, S).
- Data Modeling:
Protocol 2: Precision Phenotyping for Drought-Tolerant Root Architectures
Objective: To identify and engineer genetic variants with root systems that enhance water and nutrient uptake under stress, countering dilution effects during drought.
Diagram: Root Phenotyping Workflow
Materials: Vertical confocal microscope, growth chambers, reagents for single-cell RNA sequencing, model plants (e.g., Arabidopsis thaliana), target crop plants.
Methodology:
- Live-Imaging: Use a custom-built vertical confocal microscope to track the developmental progression of individual root cells from stem cells to differentiated tissues under control and stress conditions [77].
- Transcriptomic Mapping: Perform single-cell and spatial transcriptomics on root samples to create high-resolution maps of gene expression and hormone signaling (e.g., brassinosteroids) across different cell types and over time [77].
- Data Integration: Combine live-imaging and transcriptomic datasets to trace how specific gene expression patterns orchestrate root growth and stress responses.
- Target Identification: Identify key cell-type-specific promoter-gene pairs that regulate desirable traits, such as deeper root growth. These become targets for precision engineering in crops [77].
Protocol 3: Implementing a Variable-Rate Nitrogen (VRN) Application System
Objective: To optimize nitrogen application in real-time to match crop demand, maximizing yield and quality while minimizing nutritional dilution and environmental loss.
Diagram: VRN System Implementation
Materials: Satellite/drone imagery service, soil sensors, GPS-enabled variable-rate fertilizer applicator, data analysis platform (e.g., Farmonaut), soil test kits.
Methodology:
- Data Acquisition:
- Pre-Season: Collect soil samples by management zone and analyze for baseline N.
- In-Season: Subscribe to a frequent (e.g., weekly) multispectral satellite imagery service (e.g., USDA CDL, commercial providers) to monitor crop biomass and Normalized Difference Vegetation Index (NDVI) [79] [80]. Supplement with drone flights for high-resolution spot checks.
- Algorithm & Prescription:
- Application & Validation:
- Execute the VRN application across the field.
- Continue monitoring with remote sensing and targeted tissue sampling to validate the effectiveness of the application and make adjustments as needed in a feedback loop.
Core Metrics and Quantitative Data
This section details the essential quantitative metrics for assessing soil vitality, which forms the foundation for crop nutritional quality.
Soil Health Indicators and Their Functions
The following table summarizes key soil health indicators, which are measurable properties that provide clues about how well the soil functions [83].
| Indicator Category | Specific Metric | Target/Healthy Range | Primary Function in Soil Health |
|---|---|---|---|
| Chemical | Soil pH [84] | 6.0 - 7.0 (for most crops) | Regulates biological and chemical activity thresholds; critical for nutrient availability [83] [84]. |
| Soil Nitrate [83] | Context-dependent | Indicates plant-available nitrogen and potential for nitrogen loss [83]. | |
| Extractable Phosphorus & Potassium [83] | Context-dependent | Measures plant-available nutrients and potential for phosphorus loss [83]. | |
| Physical | Bulk Density [83] | Varies by soil type | Indicator of soil compaction and porosity; affects root growth and water movement [83]. |
| Water Holding Capacity [83] | Higher is better | Determines retention and transport of water and nutrients; habitat for soil microbes [83]. | |
| Infiltration [83] | Higher is better | Indicates soil structure and porosity; affects water runoff and erosion [83]. | |
| Biological | Soil Organic Matter (SOM) [83] | >2% is generally good | Improves nutrient retention, soil fertility, structure, stability, and reduces erosion [83]. |
| Microbial Biomass C & N [83] | Higher is better | Represents microbial catalytic potential and repository for carbon and nitrogen [83]. | |
| Potentially Mineralizable N [83] | Higher is better | Indicator of soil productivity and nitrogen-supplying potential [83]. | |
| Soil Respiration [83] | Moderate, stable levels | Measure of microbial activity [83]. |
Soil pH Adjustment Quantities
Maintaining the correct soil pH is critical for ensuring nutrients are available to plants and not diluted in the soil [84]. The amounts of amendments needed to adjust pH are quantified below.
Pounds of Limestone Needed to Raise pH (per 1,000 square feet)
| Current pH → Target 6.5 | Sandy Soil (lbs) | Loam Soil (lbs) | Clay Soil (lbs) |
|---|---|---|---|
| 4.0 → 6.5 | 60 | 161 | 230 |
| 4.5 → 6.5 | 50 | 130 | 190 |
| 5.0 → 6.5 | 40 | 100 | 150 |
| 5.5 → 6.5 | 30 | 80 | 100 |
| 6.0 → 6.5 | 15 | 40 | 60 |
Source: [84]
Pounds of Sulfur Needed to Lower pH (per 1,000 square feet)
| Current pH → Target 6.5 | Sandy Soil (lbs) | Loam Soil (lbs) | Clay Soil (lbs) |
|---|---|---|---|
| 8.5 → 6.5 | 45 | 60 | 70 |
| 8.0 → 6.5 | 30 | 35 | 45 |
| 7.5 → 6.5 | 10 | 20 | 25 |
| 7.0 → 6.5 | 2 | 4 | 7 |
Source: [84]
Experimental Protocols
Protocol 1: Comprehensive Soil Health Assessment
Objective: To systematically evaluate the chemical, physical, and biological properties of soil for a holistic health assessment [83] [84].
Methodology:
- Sample Collection:
- Timing: Sample annually, preferably in the fall. Test high-value crops more frequently [84].
- Technique: Using a soil probe or auger, collect 6-8 core samples from the top 6 inches of soil from different, random locations in the field or plot. Combine these sub-samples in a clean plastic bucket to form a composite sample [84].
- Submission: Place approximately 2 cups of the composite soil in a labeled bag and send it to an accredited soil testing laboratory [84].
Laboratory Analysis:
- Request analysis for the core metrics listed in Table 1.1, including macro- and micronutrients, soil organic matter (SOM), and pH [83] [84].
- For advanced biological assessment, request tests for Microbial Biomass Carbon and Potentially Mineralizable Nitrogen, which are key indicators of the soil's living ecosystem and its capacity to cycle nutrients [83].
Data Interpretation:
Protocol 2: Integrated Nutrient Management (INM) Trial
Objective: To compare the effects of conventional fertilization versus INM on crop yield, nutrient use efficiency, and soil health parameters.
Methodology:
- Experimental Design: Establish a randomized complete block design with a minimum of three replications. Treatments should include:
- Data Collection:
- Soil Analysis: Pre-planting and post-harvest soil sampling as per Protocol 1.
- Plant Tissue Analysis: Collect leaf samples at peak growth stage to measure nutrient concentration and identify potential dilution effects.
- Yield Measurement: Record grain and biomass yield at harvest.
- Nutrient Use Efficiency (NUE): Calculate NUE using the difference method: (Nutrient uptake in fertilized plot - Nutrient uptake in control plot) / Quantity of nutrient applied [1].
Diagnostic Workflows and Signaling Pathways
Soil Health Diagnosis and Management Pathway
Research Workflow for Nutrient Dilution Studies
The Scientist's Toolkit: Research Reagent Solutions
| Reagent/Material | Function in Experimentation |
|---|---|
| Soil Testing Kit | Provides an easy, accurate way to conduct initial field assessment of soil nutrient levels and pH [84]. |
| Bioinoculants | Contains beneficial microbes (e.g., mycorrhizal fungi, rhizobia) that enhance nutrient availability and uptake, a key component of INM [1]. |
| Controlled-Release Fertilizers | Advanced fertilizer formulations designed to release nutrients gradually to match crop demand, thereby improving Nutrient Use Efficiency (NUE) and reducing losses [1]. |
| Plant Growth Regulators | Chemicals used to enhance nutrient uptake and improve crop yields under stress conditions [84]. |
| Micronutrient Fertilizers | Targeted fertilizers (e.g., containing Zinc, Iron) used to correct specific soil deficiencies that contribute to nutritional dilution in crops [84]. |
Frequently Asked Questions (FAQs)
Q1: My soil test shows adequate nutrients, but my crop tissue analysis still indicates low nutrient levels. What is the cause of this nutrient dilution? A: This is a classic sign of nutrient dilution. The problem is not a lack of nutrients in the soil, but their poor availability and uptake by the plant. This can be caused by:
- Soil pH Imbalance: A pH outside the optimal range (typically 6.0-7.0) can "lock up" nutrients, especially phosphorus, making them unavailable to plants [84].
- Poor Soil Biology: Low microbial activity reduces the mineralization of organic matter into plant-available forms [83].
- Imbalanced Fertilization: Excessive application of one nutrient can inhibit the uptake of another.
- Water Stress: Both drought and waterlogging can disrupt nutrient transport within the plant.
Q2: How can I improve the efficiency of nitrogen use in my trials to minimize environmental loss and maximize plant uptake? A: Improving Nitrogen Use Efficiency (NUE) is critical. Move beyond conventional single-application methods by adopting:
- The 4R Framework: Apply the right source of fertilizer, at the right rate, at the right time, and in the right place [1].
- Split Applications: Divide the total nitrogen dose and apply it at key growth stages to better match crop demand [85].
- Use Enhanced Efficiency Fertilizers: Incorporate slow- or controlled-release fertilizers to provide a steady nutrient supply [1].
- Combine with Organic Sources: Integrated Nutrient Management (INM), which combines ~75% mineral fertilizer with organic amendments like manure, has been shown to improve soil structure and NUE simultaneously [1].
Q3: What is the minimum set of metrics I should track to reliably monitor changes in soil vitality over time? A: A robust minimum dataset includes indicators from all three categories:
- Chemical: Soil pH, Extractable Phosphorus, Potassium, and Nitrate [83] [84].
- Physical: Bulk Density (as an indicator of compaction) and Aggregate Stability (if possible) [83].
- Biological: Soil Organic Matter (SOM) is the single most informative overall health metric. For a more advanced toolkit, add Microbial Biomass Carbon or Potentially Mineralizable Nitrogen [83]. Tracking these over time provides a holistic picture of soil functioning.
Q4: How often should soil health and plant nutrient status be tested in a long-term study? A: For rigorous research:
- Soil should be tested at a minimum once per year, ideally at the same seasonal point (e.g., pre-planting) [84].
- In systems with high-value crops or intensive management, seasonal testing may be warranted [84].
- Plant tissue testing should be conducted at critical growth stages (e.g., flowering) to diagnose in-season nutrient status and correlate with soil data.
- If results are stable over consecutive years, the sampling frequency for soil can be reduced to once every two to three years for monitoring purposes [84].
Troubleshooting Guides & FAQs
This technical support center provides resources for researchers investigating the decline of nutritional density in the food system and developing strategies to counteract it. The following guides address common experimental and methodological challenges in this field.
FAQ: Nutritional Density Fundamentals
Q1: What is the operational definition of "nutritional dilution" in modern agricultural research?
Nutritional dilution refers to the observed decrease in the concentration of essential vitamins, minerals, and phytonutrients in crops over past decades, coinciding with yield-focused agricultural practices [86]. It is a quantifiable phenomenon where increases in crop biomass or yield do not proportionally increase the micronutrient content, leading to a lower nutrient-to-calorie ratio. Research links this trend to soil degradation and intensive farming methods [87] [88].
Q2: What is the empirical evidence linking soil health to the nutrient density of food?
Controlled paired-farm studies provide direct evidence. A 2022 analysis comparing regenerative and conventional farms found statistically significant increases in nutrient levels in regeneratively grown crops [87]. The table below summarizes key findings.
Table 1: Nutrient Density Comparison: Regenerative vs. Conventional Crops
| Nutrient | Average Increase in Regenerative Crops | Specific Crop Examples |
|---|---|---|
| Vitamin K | 34% | - |
| Vitamin E | 15% | - |
| Phytosterols | 22% | - |
| Calcium | 11% | - |
| Copper | 27% | - |
| Zinc | 17-23% more | Corn, Soy, Sorghum |
| Phenolics | 400% more; 60-70% more | Spinach; Carrots |
| Carotenoids | 15% more; 48% more (vs. organic) | General; Cabbage |
Preliminary data from the Rodale Institute's Vegetable Systems Trial further supports this, showing that organic practices increase easily degradable organic carbon in soil by 30%, a key indicator of soil health linked to nutrient availability for plants [87].
Q3: Which emerging technologies show the most promise for rapidly quantifying nutrient density in crops and soil?
Near-Infrared (NIR) Spectroscopy is a leading non-destructive technology for high-throughput nutritional assessment [87] [86]. The Bionutrient Institute is developing handheld spectrometers that use NIR to estimate nutrient levels by analyzing how light interacts with a sample's molecular bonds [86].
While a consumer-facing device is not yet commercially available, the research framework and open-source data platform are established. This technology is critical for building the large-scale datasets needed to correlate growing conditions with final nutritional outcomes [87] [86]. Other technologies in use include X-ray Fluorescence (XRF) for mineral analysis and Raman Spectroscopy [86].
Troubleshooting Guide: Supply Chain & Post-Harvest Experiments
Challenge: High rate of nutrient degradation in fresh produce during post-harvest storage, confounding clinical sample preparation.
Solution: Implement advanced preservation technologies to maintain sample integrity from harvest to analysis.
- Detailed Protocol: Applying a Nano-enhanced Edible Coating for Sample Preservation
- Objective: To significantly reduce the degradation of heat-sensitive antioxidants (e.g., Vitamin C, phenolics) and moisture loss in fresh produce samples.
- Materials:
- Chitosan-based nanoparticle solution (e.g., 1% w/v chitosan with 0.05% Zinc Oxide nanoparticles) [89].
- Food-grade glycerol (as plasticizer).
- Sample fruits/vegetables.
- Dipping rack, beakers, pH meter, magnetic stirrer.
- Procedure:
- Solution Preparation: Synthesize or procure a chitosan-ZnO nanocomposite solution. Adjust pH to 5.6 using acetic acid. Stir for at least 2 hours to ensure homogeneity [89].
- Sample Preparation: Clean and sanitize produce samples. Air-dry at room temperature to remove surface moisture.
- Coating Application: Immerse samples in the nanocomposite solution for 2 minutes under gentle agitation to ensure uniform coverage.
- Drying: Drain excess solution and allow coated samples to air-dry in a controlled environment (e.g., 25°C, 60% RH) for 1 hour to form a thin, solid film.
- Storage: Store treated and control samples under identical conditions (e.g., 10°C, 85% RH). Monitor nutrient levels at defined intervals.
Table 2: Key Reagent Solutions for Nutrient Preservation Studies
| Research Reagent / Material | Function in Experiment | Key Considerations |
|---|---|---|
| Chitosan-based Nanoparticles | Forms a semi-permeable edible coating that reduces oxygen uptake and moisture loss [89]. | Biocompatible and biodegradable. Antimicrobial efficacy is concentration-dependent. |
| Zinc Oxide (ZnO) Nanoparticles | Incorporated into coatings to provide enhanced antimicrobial and UV-blocking activity, slowing spoilage [89]. | Safety and migration profiles must be validated for food use. |
| Silver Nanoparticles | Potent antimicrobial agent used in packaging and coatings to inhibit microbial growth [89]. | Regulatory approval for food contact is a major hurdle; primarily a research tool. |
| Calcium Nanoparticles | Used in coatings or treatments to fortify produce and maintain firmness by strengthening cell wall structures [89]. | Can help reduce post-harvest physiological disorders. |
Challenge: Differentiating the effects of "genetic potential" from "post-harvest handling" on the nutritional quality of clinical trial materials.
Solution: Employ a controlled sourcing and tracking workflow to isolate variables.
The following experimental workflow ensures the integrity of samples from source to analysis, allowing for accurate attribution of nutritional outcomes.
The Scientist's Toolkit: Key Research Reagent Solutions
Table 3: Essential Materials for Investigating Soil-Plant Nutrient Pathways
| Reagent / Tool | Function | Application Note |
|---|---|---|
| Arbuscular Mycorrhizal Fungi (AMF) Inoculants | Bioinoculants that form symbiotic relationships with plant roots, enhancing uptake of water and immobile nutrients like phosphorus and zinc [87]. | Critical for studies on mineral density. Disrupted by conventional tillage. |
| ERGO (Ergothioneine) Assay Kits | Quantify a potent antioxidant in food samples. ERGO levels in plants are dependent on soil fungi and are a biomarker for soil health practices [87]. | Use to validate the link between regenerative practices, soil biology, and food antioxidant levels. |
| Biofertilizers & Biostimulants | Organic solutions that provide plant nutrition and induce resistance without synthetic chemicals, aligning with organic systems research [1] [90]. | Used in Integrated Nutrient Management (INM) studies to reduce reliance on chemical fertilizers [1]. |
| Handheld NIR Spectrometer | For rapid, non-destructive field estimation of nutritional density and soil organic carbon [87] [86]. | Requires robust calibration models. Data is predictive and should be confirmed with standard lab assays for publication. |
| Controlled Atmosphere Storage (CAS) Systems | Regulates O₂ and CO₂ levels in storage to slow produce respiration and preserve nutrient content [89] [91]. | Parameter optimization is key to avoid low O₂ or high CO₂ injury to the produce. |
Technical Support Center: Troubleshooting Guides and FAQs
This technical support center is designed for researchers and scientists developing climate-resilient crops with enhanced nutritional quality. The guidance below focuses on overcoming common experimental hurdles in CRISPR-Cas9 workflows and bio-input applications to combat nutritional dilution in modern agriculture.
CRISPR-Cas9 Experimental Troubleshooting
Question 1: Why do different sgRNAs targeting the same gene show variable editing efficiency? Gene editing efficiency is highly influenced by the intrinsic properties of each sgRNA sequence [92]. To enhance result reliability, design at least 3–4 sgRNAs per gene to mitigate the impact of individual sgRNA performance variability [92].
Question 2: What are the primary risks of unintended edits, and how can they be minimized? The main risks are:
- Off-target effects: The Cas protein cuts DNA at an unintended location [93].
- On-target rearrangements: The Cas protein cuts at the right site, but erroneous edits occur during DNA repair [93]. Use high-fidelity Cas variants (e.g., SpCas9-HF1, eSpCas9) and carefully design sgRNAs with optimized specificity to minimize these risks [94].
Question 3: How much sequencing data is required for a CRISPR screen? It is generally recommended that each sample achieves a sequencing depth of at least 200x [92]. The required data volume can be estimated as: Required Data Volume = Sequencing Depth × Library Coverage × Number of sgRNAs / Mapping Rate [92].
Question 4: If no significant gene enrichment is observed in a screen, what could be the problem? This is commonly due to insufficient selection pressure during the screening process [92]. To address this, increase the selection pressure and/or extend the screening duration to allow for greater enrichment of cells with the intended phenotype [92].
Question 5: What is the most reliable way to determine if a CRISPR screen was successful? The most reliable method is to include well-validated positive-control genes by incorporating their corresponding sgRNAs into the library [92]. If these controls are significantly enriched or depleted as expected, it strongly indicates effective screening conditions [92].
Bio-Inputs and Integration FAQs
Question 1: What are the most effective bio-inputs for sustainable crop production? The most effective bio-inputs include multi-strain biofertilizers, targeted biopesticides like Bacillus thuringiensis, and advanced biostimulants derived from seaweed and humic acids [52]. Their efficacy depends on the specific crop, local soil conditions, and farm challenges [52].
Question 2: Can bio-inputs fully replace synthetic fertilizers and pesticides? In many contexts, integrated use can significantly reduce synthetic input needs [52]. As formulations improve, more farms are operating with minimal or zero synthetic reliance, which helps maintain soil microbial health and reduce nutritional dilution in crops [52].
Question 3: What are common data quality pitfalls in bioinformatics analysis for these fields?
- Sample Mislabeling: Affects up to 5% of samples in some labs [95].
- Batch Effects: Systematic differences from non-biological factors like processing times [96].
- Gene Name Errors: ~20% of publications with supplemental Excel gene lists contain incorrect gene names converted to dates [96]. Implementing standardized protocols (SOPs) and automated validation pipelines is crucial to prevent these issues [95].
Table 1: Key Bioinformatics and Screening Metrics
| Parameter | Recommended Threshold | Consequence of Deviation |
|---|---|---|
| CRISPR Screen Sequencing Depth [92] | ≥ 200x per sample | Increased false positives/negatives; reduced accuracy [92]. |
| Library Coverage [92] | > 99% | Loss of target genes before selection begins [92]. |
| Sample Correlation (Replicates) [92] | Pearson R > 0.8 | Low reproducibility; requires pairwise analysis instead of combined analysis [92]. |
| URL Archival Stability (Software) [97] | N/A | 28% of bioinformatics resources are inaccessible via published URLs, hindering reproducibility [97]. |
Table 2: Bio-Input Adoption Trends and Efficacy (Projected for 2025)
| Bio-Input Category | Key Components | Primary Function | Projected Market Share (2025) [52] |
|---|---|---|---|
| Biofertilizers | Rhizobium, Azotobacter, Mycorrhizal fungi | Fix atmospheric nitrogen, solubilize phosphates, improve nutrient uptake [52]. | |
| Biopesticides | Bacillus thuringiensis, Neem oil, Trichoderma fungi | Target specific pests, combat plant pathogens, reduce chemical residues [52]. | 30% of global agricultural inputs [52] |
| Biostimulants | Seaweed extracts, Humic acids | Stimulate natural plant processes, improve stress tolerance and root development [52]. |
Experimental Protocols & Methodologies
Protocol 1: Validating CRISPR-Edited Lines for Nutritional Traits This protocol ensures that edits in stress-resilience genes do not inadvertently reduce nutrient density.
- Design: Create at least 3-4 sgRNAs per target gene (e.g., transcription factors like DREB2A or AREB1 involved in stress response and nutrient metabolism) to ensure efficient knockout [92] [98].
- Delivery: Use CRISPR Ribonucleoprotein (RNP) complexes for transient editing, reducing off-target effects and avoiding plasmid integration [98].
- Molecular Analysis:
- Sanger Sequencing: Confirm precise edits at the target locus.
- Whole-Genome Sequencing: Conduct on at least two independent lines to screen for off-target effects [93].
- Phenotypic Screening:
- Subject edited lines to abiotic stresses (drought, salinity).
- Analyze nutritional content (e.g., micronutrients, proteins) to confirm that stress resilience is achieved without nutritional dilution [98].
Protocol 2: Integrating Bio-Inputs with CRISPR-Edited Crops This protocol tests synergistic effects of bio-inputs on the performance of climate-resilient, nutritionally enhanced lines.
- Seed Treatment: Coat CRISPR-edited seeds with a consortium of biofertilizers (e.g., nitrogen-fixing Rhizobium and phosphate-solubilizing bacteria) [52].
- Experimental Design: Set up a controlled field trial with three groups:
- Group A: CRISPR-edited seeds + bio-inputs.
- Group B: CRISPR-edited seeds + conventional inputs.
- Group C: Wild-type seeds + conventional inputs (control).
- Application:
- At the 4-leaf stage, apply biostimulant foliar sprays (e.g., seaweed extract) to enhance abiotic stress tolerance [52].
- Use biopesticides (e.g., Bacillus thuringiensis) for targeted pest control as needed.
- Data Collection:
- Yield Metrics: Measure biomass and grain yield at harvest.
- Nutritional Analysis: Quantify micronutrient and protein content in grains.
- Soil Health: Monitor microbial diversity and organic matter content [52].
Visualization of Workflows and Pathways
The following diagrams illustrate key experimental workflows and molecular relationships central to developing nutrient-dense, climate-resilient crops.
Diagram 1: CRISPR trait development workflow.
Diagram 2: Stress signaling and nutrient pathway crosstalk.
The Scientist's Toolkit: Research Reagent Solutions
Table 3: Essential Reagents and Tools for Climate-Resilient Crop Research
| Reagent / Tool | Function | Application Note |
|---|---|---|
| High-Fidelity Cas Variants (e.g., SpCas9-HF1) [94] | Reduces off-target effects during genome editing. | Critical for ensuring editing precision in complex crop genomes. |
| RNP Complexes [98] | Enables transient editing without DNA integration. | Helps avoid GMO regulatory hurdles in some countries and simplifies the approval process [98]. |
| Multi-Strain Biofertilizers [52] | Improves nutrient uptake and soil health. | Use for seed treatment to enhance early plant establishment and nutrient acquisition, countering dilution. |
| Biopesticides (e.g., Bacillus thuringiensis) [52] | Provides targeted pest control. | Integrate into IPM strategies to protect yield without harmful chemical residues. |
| Biostimulants (Seaweed extracts) [52] | Enhances abiotic stress tolerance. | Apply as a foliar spray during stress-prone growth stages to maintain yield and nutritional quality under drought or heat. |
| MAGeCK Tool [92] | Statistical analysis of CRISPR screen data. | The Robust Rank Aggregation (RRA) algorithm is ideal for single-condition comparisons (treatment vs. control) [92]. |
Synthesizing a Unified Framework for a Nutrient-Dense Food System
A unified framework for a nutrient-dense food system integrates agricultural production, environmental sustainability, and human health to counter nutritional dilution—the decline in nutrient content of food due to environmental and agricultural practices [1]. This framework is built on the core principle that food systems must operate within planetary boundaries while ensuring social equity and human health [99].
The 2025 EAT-Lancet Commission emphasizes that global food systems are the largest contributor to transgressing five of nine planetary boundaries, contributing approximately 30% of global greenhouse gas emissions [99]. Simultaneously, current systems fail to meet basic human needs, with fewer than 1% of the global population living in a "safe and just space" where rights and food needs are met sustainably [99]. The framework addresses these dual challenges through three interconnected pillars: sustainable production, dietary consumption transformation, and equitable distribution [99].
Core Components of the Unified Framework
- Sustainable Nutrient Management: Implementing integrated nutrient management (INM) practices to enhance soil health and crop nutrient density while reducing environmental impact [1]
- Dietary Pattern Shift: Promoting adoption of the Planetary Health Diet, emphasizing diverse plant-rich foods with optional modest animal-source foods [99]
- Social Equity Foundation: Ensuring fair wages for food system workers, protecting marginalized groups, and preserving traditional food knowledge [99]
- Systemic Efficiency: Reducing food loss and waste throughout supply chains while improving resource use efficiency [99] [100]
Technical Support Center: Troubleshooting Nutritional Dilution
Frequently Asked Questions (FAQs)
Q1: What are the primary drivers of nutrient dilution in major food crops? Nutrient dilution occurs through multiple pathways: elevated atmospheric CO₂ levels reducing mineral concentrations in crops [1], soil degradation from intensive farming practices depleting micronutrients [1] [100], and conventional plant breeding prioritizing yield over nutrient content [1]. Soil degradation affects nearly one-third of global arable land, with over 75 billion tonnes of soil lost annually to erosion, directly impacting nutrient retention capacity [100].
Q2: Which nutrient management strategies most effectively enhance crop nutrient density? Integrated Nutrient Management (INM) combining organic amendments, precision fertilization, and soil health management demonstrates significant efficacy. Research shows INM can increase crop yields by 8–150% compared to conventional practices while improving micronutrient density [1]. Specific protocols include combining 75% NPK fertilizers with 10 t ha⁻¹ farmyard manure and bioinoculants, which maintains productivity while reducing chemical fertilizer dependence [1].
Q3: How does climate change specifically affect nutrient availability in cropping systems? Climate impacts occur through several mechanisms: elevated temperatures alter soil nutrient cycling and microbial activity; erratic rainfall patterns increase nutrient leaching; and extreme weather events disrupt nutrient application schedules [1]. These factors collectively reduce Nutrient Use Efficiency (NUE), particularly for nitrogen where only 30–40% of applied N is typically utilized by crops [1].
Q4: What monitoring technologies best track nutrient density in field conditions? Precision agriculture technologies provide effective monitoring: satellite and drone imagery assess crop health and nutrient status [100], sensor-based systems monitor real-time soil parameters (moisture, nutrients, organic content) [100], and AI-powered analytics platforms integrate diverse data streams to recommend nutrient management interventions [1] [100].
Troubleshooting Guides
Problem: Declining Micronutrient Content in Staple Crops
Symptoms: Reduced concentrations of zinc, iron, and vitamins in harvested grains despite adequate yields; increased incidence of nutrient deficiency disorders in local populations.
Diagnostic Protocol:
- Soil Analysis: Comprehensive testing of soil micronutrients, pH, and organic matter every 3 months
- Plant Tissue Testing: Monitor nutrient levels at critical growth stages (vegetative, flowering, maturity)
- Environmental Assessment: Evaluate temperature patterns, precipitation changes, and CO₂ exposure levels
- Genetic Assessment: Analyze crop varieties for nutrient efficiency traits
Resolution Strategies:
- Amendment Strategy: Apply targeted micronutrient fertilizers combined with organic amendments
- Soil Health Focus: Implement cover cropping and reduced tillage to improve nutrient retention
- Varietal Selection: Transition to climate-resilient, nutrient-efficient cultivars
- Management Practice: Adopt site-specific nutrient management (SSNM) using precision agriculture technologies [1]
Problem: Soil Degradation and Nutrient Mining
Symptoms: Soil erosion visible in fields, declining organic matter, increasing fertilizer requirements for same yield levels, crusting or compaction issues.
Diagnostic Protocol:
- Erosion Assessment: Measure soil loss rates using erosion pins or satellite monitoring
- Physical Testing: Evaluate soil structure, compaction, and water infiltration rates
- Biological Assessment: Test microbial biomass and activity through respiration rates
- Chemical Analysis: Comprehensive soil nutrient testing and monitoring of cation exchange capacity
Resolution Strategies:
- Conservation Agriculture: Implement no-till farming with crop residue retention
- Diverse Rotations: Introduce legume-based crop rotations and cover crops
- Organic Amendments: Regular application of compost, biochar, or manure
- Contour Farming: Establish terraces and buffer strips in sloping landscapes [1] [100] [101]
Experimental Protocols for Nutrient Density Research
Protocol: Evaluating Nutrient Management Impact on Crop Nutrient Density
Objective: Quantify the effects of integrated nutrient management on micronutrient content in staple crops under climate stress conditions.
Materials:
- Experimental Site: Representative field with documented soil nutrient status
- Crop Material: Standardized seeds of target crop (minimum 3 varieties)
- Nutrient Sources: Chemical fertilizers, organic amendments, bioinoculants
- Monitoring Equipment: Soil moisture sensors, nutrient testing kits, weather stations
- Analysis Tools: ICP-MS for mineral nutrient analysis, HPLC for vitamin quantification
Methodology:
- Experimental Design: Randomized complete block design with 5 treatments and 4 replications
- Treatment Applications:
- Climate Stress Simulation: Implement temperature/water stress during critical growth stages
- Data Collection:
- Soil sampling (pre-planting, mid-season, post-harvest)
- Plant tissue sampling at multiple growth stages
- Yield component measurements at harvest
- Nutrient analysis of edible portions
- Statistical Analysis: ANOVA with post-hoc tests to determine treatment effects
Expected Outcomes: Quantification of optimal nutrient combinations for maintaining crop nutrient density under stress conditions; correlation between soil health parameters and crop nutrient content.
Protocol: Assessing Biofortification Efficacy Under Climate Variability
Objective: Evaluate the stability of nutrient-enhanced crop varieties across diverse environmental conditions.
Materials:
- Plant Materials: Biofortified and conventional varieties of target crop
- Field Sites: Multiple locations representing different agro-ecological zones
- Climate Monitoring: Automated weather stations at each location
- Soil Characterization: Full soil profile analysis at each site
- Laboratory Equipment: Nutrient analysis instrumentation (AAS, ICP-OES)
Methodology:
- Multi-location Trials: Establish identical experiments across minimum 3 locations with contrasting environments
- Standardized Management: Implement identical nutrient and water management across locations
- Environmental Monitoring: Record temperature, precipitation, soil moisture throughout growing season
- Harvest Analysis: Measure yield components and conduct comprehensive nutrient profiling
- Stability Analysis: Calculate stability indices for nutrient density across environments
Expected Outcomes: Identification of most stable biofortified lines; understanding of genotype × environment interactions on nutrient expression; climate-resilient biofortification recommendations.
Data Presentation: Quantitative Framework Indicators
Table 1: Nutrient Management Impact on Crop Productivity and Quality
| Management Practice | Yield Impact (%) | Nutrient Use Efficiency Gain | Soil Health Improvement | Environmental Impact Reduction |
|---|---|---|---|---|
| Integrated Nutrient Management | +8 to +150 [1] | High (30-50% [1]) | Significant (organic matter +15-30% [1]) | Medium-High (N losses -20-40% [1]) |
| Precision Agriculture | +10 to +25 [100] | Very High (40-60% [1]) | Moderate | High (fertilizer use -15-30% [1]) |
| Conservation Agriculture | +5 to +15 | Medium | Very Significant (erosion reduction 50-80% [100]) | Medium (carbon sequestration) |
| Organic Amendments Only | -10 to +5 [1] | Low-Medium | High | Low-Medium |
| Conventional Practice | Baseline | Low (NUE 30-40% [1]) | Declining | High (GHG emissions + nutrient leaching [1]) |
Table 2: Planetary Health Diet Recommendations for Nutrient Density
| Food Group | Recommended Weekly Intake (grams) | Key Nutrients Provided | Current Global Consumption Status |
|---|---|---|---|
| Whole Grains | 2100-2300g | B vitamins, zinc, iron, fiber | Insufficient in all regions [99] |
| Fruits & Vegetables | 4200-5100g | Vitamins A, C, K, potassium, folate | Consistently inadequate globally [99] |
| Nuts & Legumes | 1400-1600g | Protein, healthy fats, magnesium | Below recommendations [99] |
| Red Meat | 0-200g [99] | Heme iron, B12, protein | Excessive in many regions (UK avg: 93g/day [99]) |
| Poultry | 0-400g [99] | Protein, B vitamins, selenium | Varies by region, increasing globally [99] |
| Fish | 0-700g [99] | Omega-3, protein, vitamin D | Below recommendations in most regions [99] |
Research Reagent Solutions for Nutrient Density Studies
Table 3: Essential Research Materials for Nutrient Density Experiments
| Reagent/Material | Function in Research | Application Specifics |
|---|---|---|
| Soil Testing Kits | Quantitative analysis of soil macronutrients and micronutrients | Pre-planting soil assessment; monitoring nutrient availability during growth season |
| Leaf Tissue Sampling Kits | Plant nutrient status evaluation at critical growth stages | Diagnosis of nutrient deficiencies; monitoring nutrient uptake efficiency |
| ICP-MS Standards | Calibration for precise mineral nutrient quantification in plant tissues | Essential for accurate measurement of micronutrients (Zn, Fe, Se) in edible portions |
| ELISA Kits for Vitamin Analysis | Quantification of fat-soluble and water-soluble vitamins | Assessment of vitamin content in biofortified crops; stability studies |
| Bioinoculants | Microbial amendments to enhance nutrient availability | Rhizobia, mycorrhizae, PGPR to improve nutrient uptake and stress tolerance [1] |
| Slow-Release Fertilizers | Controlled nutrient release matching crop demand | Reduction of nutrient losses; improved nutrient use efficiency [1] |
| Soil Moisture Sensors | Precision monitoring of water availability | Irrigation scheduling to optimize nutrient availability and uptake |
| Remote Sensing Platforms | Non-destructive crop nutrient status assessment | Satellite, drone, or handheld sensors for large-scale nutrient monitoring |
System Visualization: Framework Architecture
Nutrient-Dense Food System Framework
Integrated Nutrient Management Workflow
Conclusion
The challenge of nutritional dilution is multifaceted, rooted in interactions between soil health, climate change, and agricultural practices. A singular solution is insufficient; instead, an integrated approach combining soil-centric management, genetic biofortification, precision technology, and robust policy support is essential. For biomedical and clinical research, this evolving landscape presents both a challenge and an opportunity. The declining nutrient density of staple foods could be a confounding variable in nutritional and pharmacological studies, potentially altering the bioavailability of plant-based compounds and impacting public health outcomes like immune function and chronic disease risk. Future research must prioritize interdisciplinary collaboration to validate the health impacts of these agricultural strategies, develop biomarkers for nutrient status, and create a food system where yield and nutrient density are mutually achievable goals, ultimately supporting long-term human health.
References
- 1. Advancing Nutrient Management Strategies for Sustainable ... [https://pmc.ncbi.nlm.nih.gov/articles/PMC12638156/]
- 2. Nutrient Dilution Food Quality → Area [https://lifestyle.sustainability-directory.com/area/nutrient-dilution-food-quality/]
- 3. An Alarming Decline in the Nutritional Quality of Foods [https://pmc.ncbi.nlm.nih.gov/articles/PMC10969708/]
- 4. Nutrient-Depleted Soil: What It Means for Our Food [https://chriskresser.com/depletion-of-soil-and-what-can-be-done/]
- 5. Soil Health - Natural Resources Conservation Service - USDA [https://www.nrcs.usda.gov/conservation-basics/natural-resource-concerns/soil/soil-health]
- 6. How Conventional Farming Methods Are Leading to Less ... [https://experiencelife.lifetime.life/article/how-conventional-farming-methods-are-leading-to-less-nutritious-food/]
- 7. Nutrient Deficiencies - an overview [https://www.sciencedirect.com/topics/agricultural-and-biological-sciences/nutrient-deficiencies]
- 8. Q&A: The role of soil health in food security and tackling ... [https://www.carbonbrief.org/qa-the-role-of-soil-health-in-food-security-and-tackling-climate-change/]
- 9. Elevated CO2 ameliorates the high temperature stress ... [https://www.nature.com/articles/s41598-024-53343-2]
- 10. Impacts of elevated temperature and CO2 concentration on ... [https://www.sciencedirect.com/science/article/pii/S0981942825001457]
- 11. Plant metabolic responses and adaptation mechanisms to ... [https://www.maxapress.com/article/doi/10.48130/grares-0024-0013?viewType=HTML]
- 12. Nutrient Management - Natural Resources Conservation Service [https://www.nrcs.usda.gov/getting-assistance/other-topics/nutrient-management]
- 13. Rapid responses of plants to temperature changes - PMC [https://pmc.ncbi.nlm.nih.gov/articles/PMC5800372/]
- 14. Nutrient Dilution → Area [https://lifestyle.sustainability-directory.com/area/nutrient-dilution/]
- 15. Disappearing Nutrients: How Modern Farming is Changing ... [https://rancholapuerta.com/2025/04/01/disappearing-nutrients-how-modern-farming-is-changing-the-food-we-eat/]
- 16. Reshaping agricultural production systems: Trade-offs and ... [https://www.sciencedirect.com/science/article/pii/S0308521X25002240]
- 17. The impact of agricultural practices on food composition [https://www.sciencedirect.com/science/article/pii/S0889157525012049]
- 18. Trade-offs between agricultural production and ecosystem ... [https://www.nature.com/articles/s41598-025-06650-1]
- 19. Nutritional challenges of staple crops due to increasing ... [https://www.sciencedirect.com/science/article/pii/S266615432400629X]
- 20. Less Nutritious Crops: Another Result of Rising CO2 [https://magazine.publichealth.jhu.edu/2024/less-nutritious-crops-another-result-rising-co2]
- 21. Climate Change is Sapping Nutrients from Our Food [https://www.environment.harvard.edu/news/climate-change-sapping-nutrients-our-food-%25C3%2594%25C3%2587%25C3%25B6-and-it-could-become-global-crisis]
- 22. Bigger crops, fewer nutrients: The hidden cost of climate ... [https://www.sciencedaily.com/releases/2025/07/250709091658.htm]
- 23. Enhancing the Nutritional Quality of Major Food Crops ... [https://pmc.ncbi.nlm.nih.gov/articles/PMC7725794/]
- 24. Building Healthy Soil with Best Management Practices [https://www.pubs.ext.vt.edu/content/pubs_ext_vt_edu/en/SPES/spes-408/spes-408.html]
- 25. Cover cropping in no-till systems [https://growingformarket.com/articles/cover-cropping-notill-systems]
- 26. Adding Cover Crops to a No-Till System [https://www.sare.org/resources/adding-cover-crops-to-a-no-till-system/]
- 27. Integrative soil health strategies in regenerative organic ... [https://www.sciencedirect.com/science/article/abs/pii/S2352009424001573]
- 28. Enhancing soil ecosystem services through sustainable ... [https://www.sciencedirect.com/science/article/pii/S1470160X21009274]
- 29. Effect of integrated organic nutrient management on growth ... [https://www.frontiersin.org/articles/10.3389/fsufs.2025.1678536/full]
- 30. Experimental Design: Best Practices - Bioinformatics [https://bioinformatics.ccr.cancer.gov/ccbr/project-support/experimental-design-best-practices/]
- 31. How AI in Precision Agriculture Drives Profitability (2025- ... [https://www.ayadata.ai/how-ai-in-precision-agriculture-drives-profitability-2025-2027-guide/]
- 32. AI Applications In Precision Agriculture: 7 Key Uses 2025 [https://farmonaut.com/precision-farming/ai-applications-in-precision-agriculture-7-key-uses-2025]
- 33. Artificial Intelligence in Sustainable Agriculture: Towards a ... [https://www.sciencedirect.com/science/article/pii/S2772375525008093]
- 34. Precision Agriculture 2025: Key Strategies & Trends [https://www.omdena.com/blog/precision-agriculture-2025-key-strategies-trends]
- 35. Advantages And Disadvantages Of Precision Agriculture ... [https://farmonaut.com/precision-farming/advantages-and-disadvantages-of-precision-agriculture-2025]
- 36. Precision Farming: Everything You Need To Know | 2025 [https://agristuff.com/farming/precision-farming-everything-you-need-to-know/]
- 37. Beginner's Guide to Precision Agriculture [https://www.chcnav.com/about/news/2025/beginners-guide-to-precision-agriculture]
- 38. Strategies for nutritionally oriented sustainable intensification [https://www.sciencedirect.com/science/article/abs/pii/S0301479725012290]
- 39. Farms.com Precision Agriculture Digital Digest | Fall 2025 [https://m.farms.com/precision-agriculture-digest/2025/fall/]
- 40. Unlocking Opportunities and Overcoming Challenges in ... [https://www.mdpi.com/2072-6643/17/3/518]
- 41. Unlocking Opportunities and Overcoming Challenges in ... [https://pubmed.ncbi.nlm.nih.gov/39940376/]
- 42. Biofortification strategies for enhancing crop nutritional value [https://link.springer.com/article/10.1007/s44372-025-00276-3]
- 43. Biofortification: Future Challenges for a Newly Emerging ... [https://www.sciencedirect.com/science/article/pii/S2475299124024120]
- 44. Biofortification: Future Challenges to Improve Nutrition ... [https://farmingfirst.org/2025/03/biofortification-future-challenges-to-improve-nutrition-security/]
- 45. Troubleshooting Guide for Common CRISPR-Cas9 Editing ... [https://synapse.patsnap.com/article/troubleshooting-guide-for-common-crispr-cas9-editing-problems]
- 46. Troubleshooting the gene targeting process - Wyss Institute [https://wyss.harvard.edu/news/troubleshooting-the-gene-targeting-process/]
- 47. Multigene engineering in plants: Technologies ... [https://pubmed.ncbi.nlm.nih.gov/40882716/]
- 48. No colonies after bacterial transformation - clyte [https://www.clyte.tech/post/no-colonies-after-bacterial-transformation?srsltid=AfmBOopsaB5Xx2bon1UnZ7lJKCMhlirU-1a1UlK9pWf5inKq6rzIFmfo]
- 49. A Practical Guide to Developing and Troubleshooting Patient ... [https://pmc.ncbi.nlm.nih.gov/articles/PMC12566426/]
- 50. From soil to health: advancing regenerative agriculture for ... [https://www.frontiersin.org/journals/nutrition/articles/10.3389/fnut.2025.1638507/full]
- 51. Formulation Breakthroughs: The Key to Tackling ... [https://microbiologyjournal.org/formulation-breakthroughs-the-key-to-tackling-biofertilizer-shelf-life-and-quality-challenges/]
- 52. Agriculture Inputs & Bio Inputs: 2025 Planting Trends [https://farmonaut.com/blogs/agriculture-inputs-bio-inputs-2025-planting-trends]
- 53. Advances in the Development of Biofertilizers and ... [https://pmc.ncbi.nlm.nih.gov/articles/PMC10968465/]
- 54. 2025 Update on Plant Biostimulant Product Regulation ... [https://www.bdlaw.com/publications/2025-update-on-plant-biostimulant-product-regulation-under-fifra/]
- 55. Key Questions To Ask Before Investing in Biologicals [https://us.timacagro.com/news/plant-nutrition/investing-in-biological-solutions/]
- 56. Brazil Bio-Inputs Emphasize Problem-Solving [https://agrithority.com/brazil-bio-inputs-emphasize-problem-solving/]
- 57. Why do biological products not work consistently? [https://www.farmprogress.com/soil-health/why-do-biological-products-not-work-consistently-]
- 58. Benefits and Challenges for Technology Adoption and Use [https://www.gao.gov/products/gao-24-105962]
- 59. Adoption of agricultural technology in the developing world [https://www.sciencedirect.com/science/article/pii/S0305750X2100214X]
- 60. Key Challenges & Barriers to Agricultural Technology ... [https://agtech.folio3.com/blogs/agricultural-technology-adoption-barriers/]
- 61. drivers and barriers to the adoption of Digital Agriculture ... [https://www.sciencedirect.com/science/article/pii/S2772375524000649]
- 62. The Effects of Perceptions of Economic Sustainability and ... [https://www.mdpi.com/2071-1050/17/2/786]
- 63. Overcoming the Financial Barriers of Regenerative ... [https://agamerica.com/blog/financial-barriers-of-regenerative-agriculture/]
- 64. Drivers and barriers to climate-smart agricultural practices ... [https://www.sciencedirect.com/science/article/pii/S2772375524000832]
- 65. Critical dilution curves for phosphorus, potassium, and ... [https://link.springer.com/article/10.1007/s11104-025-07929-y]
- 66. 10 Common Hydroponic Problems (and How To Fix Them ... [https://nosoilsolutions.com/common-issues-hydroponic-gardeners-face/]
- 67. Troubleshooting Common Issues in Hydroponics [https://kryzen.com/troubleshooting-common-issues-in-hydroponics/]
- 68. Troubleshooting with General Hydroponics Growing System [https://www.advancednutrients.com/articles/troubleshooting-with-general-hydroponics-growing/]
- 69. Dilution rate caused nutrient limitation effects on the ... [https://www.sciencedirect.com/science/article/abs/pii/S2214714424019664]
- 70. Hydroponics 101: A Guide to Soilless Growing Systems [https://growdirector.com/guide-to-soilless-growing-systems/]
- 71. CEA Basics: Growing Methods and Media [https://www.ceagworld.com/cea-basics/cea-basics-growing-methods-and-media/]
- 72. IRROMETER FAQ [https://www.irrometer.com/faq.html]
- 73. Soil Moisture Sensor Troubleshooting and FAQs [https://www.vernier.com/til/1617?srsltid=AfmBOopvJSkuuJdyV42pTy9bXGyEpmQQ7HlC1BWJdzYcfhfi9SdN1iyO]
- 74. Cropler: Crop Monitoring & Smart Systems for Real-Time ... [https://www.cropler.io/]
- 75. CropX Agronomic Farm Management System [https://cropx.com/]
- 76. Adaptive Management Plan - Arva [https://arva.com/adaptive-management-plan/]
- 77. Precision Genetic Engineering Points to a Future of ... [https://www.caltech.edu/about/news/precision-genetic-engineering-points-to-a-future-of-sustainable-agriculture]
- 78. Genetically engineered crops for sustainably enhanced food ... [https://pmc.ncbi.nlm.nih.gov/articles/PMC9680014/]
- 79. Advanced Tools Of The Agricultural Revolution: 2025 [https://farmonaut.com/precision-farming/advanced-tools-of-the-agricultural-revolution-2025]
- 80. Research and Science - Cropland Data Layers [https://www.nass.usda.gov/Research_and_Science/Cropland/sarsfaqs2.php]
- 81. The science behind the future of farming [https://www.smartbrief.com/original/the-science-behind-the-future-of-farming]
- 82. Ways precision genetics is revolutionizing agriculture [https://geneticliteracyproject.org/2025/10/31/ways-precision-genetics-is-revolutionizing-agriculture/]
- 83. Soil Health Assessment | Natural Resources Conservation ... [https://www.nrcs.usda.gov/conservation-basics/natural-resource-concerns/soil/soil-health/soil-health-assessment]
- 84. How to Measure Soil Nutrients: A Comprehensive Guide [https://vlsci.com/blog/how-to-measure-soil-nutrients/]
- 85. Additional fine-tuning of updated Nutrient Reduction ... [https://www.mncorn.org/2025/09/16/additional-fine-tuning-of-updated-nutrient-reduction-strategy-is-needed/]
- 86. What is the status of the Bionutrient Meter? [https://www.bionutrient.org/bionutrientmeter]
- 87. A Win-Win for the Planet and Your Nutritional Health [https://foodmedcenter.org/sustainable-farming-nutrient-density/]
- 88. Nutrient Density and Soil Health: The Foundation for a ... [https://globalwellnessinstitute.org/global-wellness-institute-blog/2025/06/05/nutrient-density-and-soil-health-the-foundation-for-a-healthier-future/]
- 89. Fruit and vegetable preservation from classical to advanced ... [https://pmc.ncbi.nlm.nih.gov/articles/PMC12455070/]
- 90. Sustainable Food Production: Trends & Challenges 2026 [https://farmonaut.com/blogs/sustainable-food-production-trends-challenges-2026]
- 91. Strategies to minimize post-harvest waste of fruits and ... [https://www.sciencedirect.com/science/article/pii/S277256692500045X]
- 92. CRISPR Screen Analysis: Expert Troubleshooting Q&A [https://www.ubigene.us/application/crispr-screening-data-analytics-faq.html]
- 93. Frequently Asked Questions About CRISPR [https://innovativegenomics.org/resources/frequently-asked-questions/]
- 94. CRISPR/Cas9: a sustainable technology to enhance climate ... [https://pmc.ncbi.nlm.nih.gov/articles/PMC11958969/]
- 95. Garbage In, Garbage Out: Dealing with Data Errors ... [https://blog.omni-inc.com/blog/garbage-in-garbage-out-dealing-with-data-errors-bioinformatics]
- 96. Common Bioinformatics Data Analysis Mistakes [https://bigomics.ch/blog/experimental-design-and-data-analysis-common-bioinformatics-mistakes/]
- 97. Challenges and recommendations to improve the ... [https://pmc.ncbi.nlm.nih.gov/articles/PMC6605654/]
- 98. Editing the Future: CRISPR/Cas9 for Climate-Resilient Crops [https://www.intechopen.com/chapters/1213063]
- 99. New Eat-Lancet report emphasises urgency of global food ... [https://www.foodbev.com/news/new-eat-lancet-report-emphasises-urgency-of-global-food-system-transformation]
- 100. Daily Updates Agriculture Worldwide: Top 7 Problems 2025 [https://farmonaut.com/news/daily-updates-agriculture-worldwide-top-7-problems-2025]
- 101. How to solve 9 challenges of modern in agriculture ? 2025 [https://growdirector.com/modern-agriculture/]