Desaturase and Elongase Enzymes: A Comprehensive Guide to ALA Metabolism for Biomedical Research
This article provides a detailed examination of the desaturase and elongase enzymes central to the alpha-linolenic acid (ALA) metabolism pathway.
Desaturase and Elongase Enzymes: A Comprehensive Guide to ALA Metabolism for Biomedical Research
Abstract
This article provides a detailed examination of the desaturase and elongase enzymes central to the alpha-linolenic acid (ALA) metabolism pathway. Tailored for researchers, scientists, and drug development professionals, it covers foundational knowledge, experimental methodologies, troubleshooting strategies, and comparative analyses of enzyme isoforms. We explore the roles of FADS1, FADS2, and ELOVL enzymes in converting ALA to long-chain polyunsaturated fatty acids (LC-PUFAs) like EPA and DHA, highlighting their regulation, substrate specificity, and implications in inflammation, neurology, and metabolic disease. The content is structured to support both basic research and the development of targeted therapeutic interventions.
ALA Metabolism Unraveled: The Core Roles of Desaturase and Elongase Enzymes
Alpha-linolenic acid (ALA, 18:3n-3) serves as the essential omega-3 fatty acid precursor for the biosynthesis of long-chain polyunsaturated fatty acids (LC-PUFAs) and a vast array of specialized pro-resolving mediators (SPMs), oxylipins, and endocannabinoids. This whitepaper details the enzymatic pathway—centered on desaturase and elongase enzymes—that transforms dietary ALA into potent bioactive lipids. The discussion is framed within the current thesis that genetic polymorphisms and competitive metabolism with linoleic acid (LA, 18:2n-6) are critical regulators of pathway flux, with direct implications for inflammatory resolution, neuronal function, and cardiometabolic health.
The Core Metabolic Pathway: Desaturases and Elongases
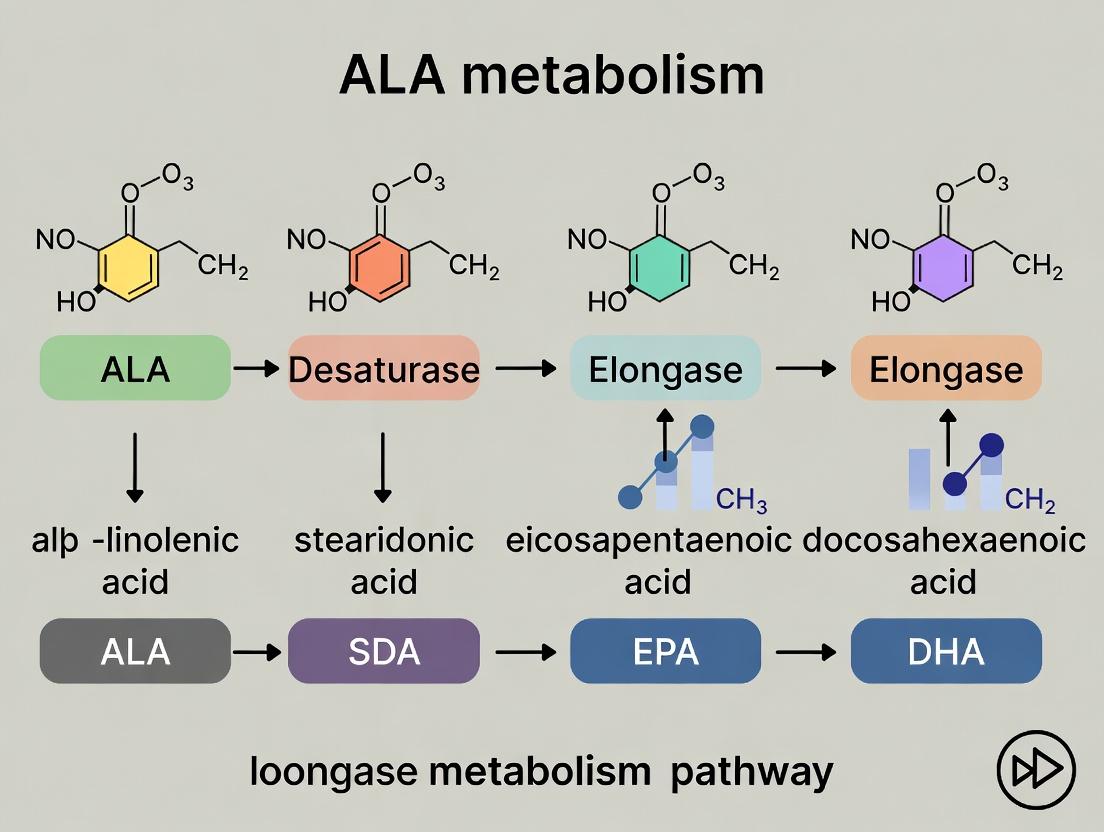
The biosynthesis of LC-PUFAs from ALA occurs primarily in the liver and involves a series of alternating desaturation and elongation reactions. The rate-limiting steps are governed by the front-end desaturases FADS1 and FADS2 and the elongases ELOVL2 and ELOVL5.
Key Enzymes and Reactions:
- Δ6-desaturase (FADS2): Catalyzes the first committed step, converting ALA to Stearidonic Acid (SDA, 18:4n-3).
- Elongase 5 (ELOVL5): Adds two carbons to SDA to form Eicosatetraenoic Acid (ETA, 20:4n-3).
- Δ5-desaturase (FADS1): Desaturates ETA to Eicosapentaenoic Acid (EPA, 20:5n-3).
- Elongase 2 (ELOVL2): Primarily elongates EPA to Docosapentaenoic Acid (DPA, 22:5n-3).
- Further elongation, a second Δ6-desaturation (likely by FADS2 in peroxisomes), and beta-oxidation yield Docosahexaenoic Acid (DHA, 22:6n-3).
Table 1: Core Enzymes of the ALA Desaturation/Elongation Pathway
| Enzyme Gene | Common Name | Reaction Catalyzed | Primary Product | Cofactor Requirement | Tissue Specificity |
|---|---|---|---|---|---|
| FADS2 | Δ6-desaturase | 18:3n-3 → 18:4n-3 | Stearidonic Acid (SDA) | NADH, Cytochrome b5 | Liver, Brain, Placenta |
| ELOVL5 | Elongase 5 | 18:4n-3 → 20:4n-3 | Eicosatetraenoic Acid (ETA) | Malonyl-CoA | Liver, Testis |
| FADS1 | Δ5-desaturase | 20:4n-3 → 20:5n-3 | Eicosapentaenoic Acid (EPA) | NADH, Cytochrome b5 | Liver, Lung, Heart |
| ELOVL2 | Elongase 2 | 20:5n-3 → 22:5n-3 | Docosapentaenoic Acid (DPA) | Malonyl-CoA | Liver, Testis, Retina |
| FADS2 | Δ6-desaturase* | 24:5n-3 → 24:6n-3 | Tetracosahexaenoic Acid | NADH, Cytochrome b5 | Liver (Peroxisomal) |
Note: FADS2 acts on 24:5n-3 in the "Sprecher shunt" pathway to DHA.
Table 2: Quantitative Conversion Efficiency of ALA to LC-PUFAs in Humans
| Metabolic Step | Substrate | Product | Estimated Conversion Efficiency* | Key Regulating Factor |
|---|---|---|---|---|
| Initial Desaturation | ALA | SDA | < 10% | Competitive inhibition by LA; FADS2 SNPs |
| First Elongation | SDA | ETA | ~80-90% | ELOVL5 expression |
| Second Desaturation | ETA | EPA | ~60-70% | FADS1 activity; n-6/n-3 ratio |
| Major Elongation | EPA | DPA | ~30-40% | ELOVL2 specificity & expression |
| Full Pathway to DHA | ALA | DHA | < 1-5% (Men) < 5-9% (Women) | ELOVL2 activity, Sprecher shunt, Sex hormones |
Note: Efficiency estimates are based on recent stable-isotope tracer studies and vary by sex, genetics, and dietary context.
Detailed Experimental Protocols
Protocol:In VitroAssay for Δ6-Desaturase (FADS2) Activity
Objective: To measure the enzymatic conversion of radiolabeled ALA to SDA in a transfected cell model. Key Applications: Screening for FADS2 inhibitors, characterizing SNP effects, studying dietary regulation.
Materials & Reagents: See The Scientist's Toolkit (Section 5). Procedure:
- Cell Culture & Transfection: Seed HEK293T cells in 6-well plates. At 60-70% confluence, transfect with a mammalian expression vector containing the human FADS2 cDNA (or mutant variant) using a polyethylenimine (PEI) protocol.
- Substrate Incubation: 48h post-transfection, replace medium with serum-free medium containing 1 µCi/mL [1-¹⁴C]-ALA (specific activity 50-60 mCi/mmol) complexed with fatty acid-free BSA (5:1 molar ratio). Incubate for 4h at 37°C, 5% CO₂.
- Lipid Extraction: Wash cells twice with ice-cold PBS. Scrape cells in 1 mL of methanol. Perform a modified Bligh & Dyer extraction: add 1 mL chloroform and 0.8 mL water. Vortex and centrifuge (1000 x g, 5 min). Collect the lower organic phase.
- Methylation & Separation: Dry organic phase under N₂ gas. Derivatize fatty acids to methyl esters (FAMEs) using 1 mL of boron trifluoride-methanol (14% w/v) at 100°C for 60 min. Extract FAMEs with hexane.
- Analysis: Separate FAMEs via argentation thin-layer chromatography (Ag⁺-TLC) on silica gel G plates impregnated with 10% AgNO₃. Develop plates in a toluene/acetonitrile (95:5, v/v) solvent system.
- Quantification: Visualize radioactive bands using a phosphorimager scanner. Identify bands by co-migration with unlabeled FAME standards. Scrape bands and quantify radioactivity by liquid scintillation counting. Activity is expressed as pmol of product formed per mg of total cellular protein per hour.
Protocol: Stable Isotope Tracer Study forIn VivoALA Kinetics
Objective: To quantify the metabolic flux of ALA to EPA, DPA, and DHA in human plasma. Key Applications: Determining conversion efficiencies, studying effects of diet, age, or genotype.
Procedure:
- Tracer Administration: After an overnight fast, administer an oral dose of 40 mg of [U-¹³C]-ALA (≥98% isotopic purity) dissolved in a small amount of olive oil to the human subject.
- Blood Sampling: Collect venous blood samples into EDTA tubes at baseline (0h), 2, 4, 6, 8, 12, 24, 48, 72, and 96h post-dose.
- Plasma Lipid Processing: Isolate plasma by centrifugation. Extract total lipids from 0.5 mL plasma using a Folch extraction (CHCl₃:MeOH, 2:1). Isolate the phospholipid fraction by solid-phase extraction (aminopropyl columns).
- FAME Preparation & GC-MS Analysis: Transesterify phospholipids to FAMEs using sodium methoxide. Analyze FAMEs using gas chromatography-combustion-isotope ratio mass spectrometry (GC-C-IRMS) or GC with high-resolution MS.
- Data Analysis: Determine isotopic enrichment (molar percent enrichment, MPE) for ALA, EPA, DPA, and DHA. Calculate fractional conversion rates and absolute synthesis rates using compartmental modeling software (e.g., SAAM II).
Downstream Bioactive Mediator Synthesis
EPA and DHA are substrates for three major enzymatic pathways:
- Cyclooxygenase (COX) & Lipoxygenase (LOX): Produce classic prostaglandins/thromboxanes and leukotrienes from EPA, but more critically, generate the Specialized Pro-resolving Mediators (SPMs)—Resolvins (from EPA and DHA), Protectins, and Maresins (from DHA)—which are potent agonists for the resolution of inflammation.
- Cytochrome P450 (CYP) Epoxygenases: Metabolize EPA and DHA to epoxy fatty acids (EpETEs and EpDPEs), which have vasodilatory and anti-inflammatory effects.
- Endocannabinoid System: EPA and DHA can be incorporated into N-acyl ethanolamines (e.g., EPEA and DHEA) and other endocannabinoid-like molecules, modulating cannabinoid receptor signaling.
The Scientist's Toolkit: Key Research Reagent Solutions
| Reagent / Material | Function & Application in ALA Pathway Research | Key Suppliers (Examples) |
|---|---|---|
| [1-¹⁴C]-Alpha-Linolenic Acid | Radiolabeled tracer for in vitro enzyme activity assays (e.g., FADS2 assay) and metabolic studies. | American Radiolabeled Chemicals, PerkinElmer |
| [U-¹³C]-Alpha-Linolenic Acid | Stable isotope-labeled tracer for human kinetic studies, GC-MS/IRMS analysis of metabolic flux. | Cambridge Isotope Labs, Sigma-Aldrich (Cayman) |
| Human FADS1/FADS2/ELOVL2/ELOVL5 cDNA Clones | For mammalian expression vector construction to study wild-type or mutant enzyme function. | DNASU Plasmid Repository, OriGene, GenScript |
| Fatty Acid-Free Bovine Serum Albumin (BSA) | Carrier protein for solubilizing and delivering hydrophobic fatty acids to cells in culture. | Sigma-Aldrich, Millipore |
| Boron Trifluoride-Methanol (BF₃-MeOH, 14%) | Derivatization reagent for converting fatty acids to volatile methyl esters (FAMEs) for GC analysis. | Supelco (Sigma-Aldrich), Thermo Scientific |
| Argentation Thin-Layer Chromatography (Ag⁺-TLC) Plates | Separates FAMEs by degree of unsaturation; critical for resolving ALA, SDA, and other pathway intermediates. | Sigma-Aldrich, Analtech |
| SPE Columns (Aminopropyl, 500 mg) | Solid-phase extraction for isolating phospholipid fraction from total lipid extracts in plasma/serum studies. | Waters, Agilent, Thermo Scientific |
| SPM Analytical Standards (RvE1, RvD1, PD1, MaR1) | LC-MS/MS standards for absolute quantification of downstream bioactive mediators from EPA/DHA. | Cayman Chemical, Larodan |
| Selective Inhibitors (e.g., SC-26196 for Δ6-desaturase) | Pharmacological tools to probe specific enzymatic steps in the pathway in vitro and in vivo. | Cayman Chemical, Tocris |
| GC Capillary Columns (High-polarity cyanopropyl) | GC-MS columns optimized for separation of geometric and positional FAME isomers (e.g., CP-Sil 88). | Agilent, Restek |
Within the broader thesis investigating the metabolic fate and physiological impact of α-linolenic acid (ALA), the coordinated activity of desaturase and elongase enzymes represents the critical regulatory node. This technical guide provides an in-depth analysis of three core enzyme families: Δ-6 desaturase (encoded by FADS2), Δ-5 desaturase (encoded by FADS1), and the ELOVL (Elongation of Very Long Chain Fatty Acids) family of elongases. Their sequential and competitive actions dictate the flux of polyunsaturated fatty acids (PUFAs) through the "Sprecher pathway" for omega-3 and omega-6 fatty acid biosynthesis, ultimately influencing membrane composition, eicosanoid profiles, and systemic metabolic health—key endpoints in nutritional and pharmacological research.
Enzyme Characterization: Structure, Function, and Kinetics
Δ-6 Desaturase (FADS2)
- Gene & Location: FADS2 on chromosome 11 (11q12.2).
- Protein Structure: Membrane-bound, non-heme di-iron enzyme localized to the endoplasmic reticulum (ER). Contains three conserved histidine boxes essential for catalytic activity.
- Primary Reaction: Introduces a double bond between carbons 6 and 7 from the methyl end of the fatty acid.
- Substrates & Products: Catalyzes the rate-limiting step for both omega-3 (ALA → Stearidonic Acid, SDA) and omega-6 (Linoleic Acid, LA → γ-Linolenic Acid, GLA) pathways.
Δ-5 Desaturase (FADS1)
- Gene & Location: FADS1 on chromosome 11 (11q12.2), in a head-to-head cluster with FADS2.
- Protein Structure: Homologous to FADS2; ER-bound, non-heme di-iron enzyme.
- Primary Reaction: Introduces a double bond between carbons 5 and 6 from the methyl end.
- Substrates & Products: Acts on omega-3 (Eicosatetraenoic Acid → Eicosapentaenoic Acid, EPA) and omega-6 (Dihomo-γ-linolenic Acid, DGLA → Arachidonic Acid, AA) substrates.
ELOVL Fatty Acid Elongases
- Gene Family: Seven members (ELOVL1-7) in humans, each with distinct substrate specificities.
- Protein Structure: ER-bound enzymes with multiple transmembrane domains. Catalyze the first, rate-limiting condensation step in the 2-carbon elongation cycle (malonyl-CoA addition).
- Key Members in PUFA Metabolism:
- ELOVL5: Elongates C18 and C20 PUFAs (e.g., GLA → DGLA; SDA → ETA).
- ELOVL2: Primarily elongates C20 PUFAs to C22 (e.g., EPA → DPA; AA → Adrenic Acid).
- ELOVL4: Involved in the elongation of C22 to C24 and C26-VLC-PUFAs, critical in neural tissues.
Table 1: Quantitative Kinetic Parameters of Key Enzymes in ALA Metabolism
| Enzyme (Gene) | Preferred Substrate (Example) | Apparent Km (μM) * | Vmax (Relative) | Primary Product | Tissue-Specific Expression (High) |
|---|---|---|---|---|---|
| Δ-6 Desaturase (FADS2) | ALA (18:3n-3) | 15-30 | 1.0 (Ref) | Stearidonic Acid (18:4n-3) | Liver, Brain, Mammary Gland |
| Linoleic Acid (18:2n-6) | 20-40 | 1.2 | γ-Linolenic Acid (18:3n-6) | ||
| Δ-5 Desaturase (FADS1) | Eicosatetraenoic (20:4n-3) | 10-25 | 2.5 | EPA (20:5n-3) | Liver, Heart, Adrenal |
| DGLA (20:3n-6) | 12-30 | 2.8 | AA (20:4n-6) | ||
| ELOVL5 | γ-Linolenic Acid (18:3n-6) | 5-15 | 1.5 | DGLA (20:3n-6) | Liver, Testis, Kidney |
| Stearidonic Acid (18:4n-3) | 5-12 | 1.3 | ETA (20:4n-3) | ||
| ELOVL2 | EPA (20:5n-3) | 2-8 | 0.8 | DPA (22:5n-3) | Liver, Testis, Retina |
| AA (20:4n-6) | 3-10 | 0.9 | Adrenic Acid (22:4n-6) |
Note: *Kinetic values are approximations from *in vitro assays using microsomal or recombinant enzyme preparations and can vary based on experimental conditions.*
Detailed Experimental Protocols
Protocol: In Vitro Microsomal Desaturase/Elongase Activity Assay
This protocol measures the direct enzymatic conversion of radiolabeled fatty acid substrates.
Materials: Fresh or frozen tissue (e.g., liver), Homogenization buffer (0.25M sucrose, 10mM HEPES, pH 7.4), Ultracentrifuge, Assay buffer (0.1M phosphate buffer, pH 7.2, 1mM NADH, 0.1mM CoA, 2mM ATP, 5mM MgCl₂), ¹⁴C- or ³H-labeled substrate (e.g., [1-¹⁴C]ALA), Lipid extraction solvents (chloroform:methanol 2:1 v/v), Thin-layer chromatography (TLC) system, Radioluminography scanner.
Procedure:
- Microsome Preparation: Homogenize tissue in cold homogenization buffer. Centrifuge at 12,000×g for 15 min (4°C) to remove nuclei/mitochondria. Ultracentrifuge the supernatant at 100,000×g for 60 min (4°C). Resuspend the microsomal pellet in assay buffer.
- Enzyme Reaction: In a glass tube, mix 100 μL microsomal protein (1-2 mg/mL), 100 μL assay buffer, and 50 nmol of labeled substrate (0.1 μCi). Incubate at 37°C for 20 min with shaking.
- Reaction Termination & Lipid Extraction: Stop the reaction with 2 mL chloroform:methanol (2:1). Add 0.5 mL of 0.9% KCl, vortex, and centrifuge to separate phases. Collect the lower organic layer.
- Product Analysis: Spot extracts on silica gel TLC plates. Develop using a hexane:diethyl ether:acetic acid (70:30:1) solvent system. Identify product bands by co-migration with authentic standards.
- Quantification: Scan plates for radioactivity. Enzyme activity is expressed as pmol of product formed per min per mg of microsomal protein.
Protocol: Stable Isotope Tracer Analysis of Pathway Flux In Vivo
This method quantifies in vivo metabolic flux through the desaturation/elongation pathway in human or animal models.
Materials: Deuterated (²H) or ¹³C-labeled precursor (e.g., [U-¹³C]ALA), GC-MS or LC-MS system, Solid-phase extraction (SPE) columns for fatty acid purification.
Procedure:
- Tracer Administration: Administer a known oral or intravenous dose of the stable isotope-labeled fatty acid (e.g., 50 mg [U-¹³C]ALA) to the fasted subject.
- Serial Blood Sampling: Collect plasma samples at baseline and at timed intervals (e.g., 2, 4, 8, 12, 24, 48, 72h).
- Lipid Extraction & Derivatization: Extract total lipids from plasma via Folch method. Isolate phospholipid fraction via SPE. Transmethylate to fatty acid methyl esters (FAMEs) using BF₃-methanol.
- Mass Spectrometric Analysis: Analyze FAMEs by GC-MS. Monitor mass isotopomer distribution for precursor and downstream products (e.g., labeled EPA, DPA, DHA).
- Flux Calculation: Use compartmental modeling or precursor-product ratio calculations to estimate fractional conversion rates and apparent flux through each enzymatic step.
Visualizations
Title: PUFA Biosynthetic Pathways for Omega-3 and Omega-6 Fatty Acids
Title: Integrated Research Workflow for Desaturase/Elongase Investigation
The Scientist's Toolkit: Essential Research Reagents & Materials
Table 2: Key Research Reagent Solutions for Desaturase/Elongase Studies
| Item | Function/Application | Example Product/Catalog |
|---|---|---|
| Radiolabeled Substrates | Direct measurement of enzymatic conversion in microsomal or cellular assays. | [1-¹⁴C]Linoleic Acid, [1-¹⁴C]α-Linolenic Acid (PerkinElmer, American Radiolabeled Chemicals) |
| Stable Isotope-Labeled Tracers | Safe, quantitative analysis of in vivo metabolic flux in humans/animals via GC/LC-MS. | [U-¹³C]ALA, [²H₅]EPA (Cambridge Isotope Laboratories, Sigma-Aldrich) |
| Recombinant Enzyme Proteins | For high-throughput inhibitor screening, structural studies, and specific activity assays. | Human FADS1, FADS2, ELOVL5 (baculovirus/Sf9 expression, e.g., Cayman Chemical) |
| Specific Chemical Inhibitors | Tool compounds to probe enzyme function and validate targets. | SC-26196 (Δ-6 Desaturase inhibitor), T-3384 (Δ-5 Desaturase inhibitor) |
| siRNA/shRNA Libraries & CRISPR/Cas9 Kits | For targeted gene knockdown or knockout in cell culture models. | SMARTpool siRNAs for FADS1/FADS2/ELOVL5 (Dharmacon), Lentiviral CRISPR kits (Sigma) |
| Fatty Acid-Analyte Kits | High-throughput, standardized quantification of PUFA profiles from biological samples. | Fatty Acid Methyl Ester (FAME) Profiling Kits (Cayman Chemical), Lipid Extraction Kits (Avanti) |
| Species-Specific Antibodies | Detection of enzyme expression, localization (IHC, Western Blot), and potential post-translational modifications. | Anti-FADS2 antibody (validated for human/mouse, e.g., from Sigma-Aldrich or Santa Cruz) |
| Specialized Diets | Control dietary PUFA intake in animal studies to modulate endogenous pathway activity. | Fat-Free Diets, ALA/LA-defined diets, DHA-enriched diets (Research Diets Inc., Dyets) |
The metabolism of α-linolenic acid (ALA, 18:3n-3) to long-chain polyunsaturated fatty acids (LC-PUFAs) like eicosapentaenoic acid (EPA) and docosahexaenoic acid (DHA) is governed by a series of desaturation and elongation reactions. This whitepaper focuses on two critical enzyme families within this pathway: the Fatty Acid Desaturase (FADS) cluster and the Elongation of Very Long-Chain Fatty Acids (ELOVL) proteins. The FADS cluster provides rate-limiting desaturase activities, while ELOVL enzymes determine carbon chain elongation specificity. Inter-individual genetic variation in FADS and tissue-specific expression of ELOVL isoforms are pivotal factors influencing LC-PUFA status, with direct implications for lipidomics, nutrigenetics, and therapeutic development.
The FADS Gene Cluster: Architecture and Key Polymorphisms
The human FADS cluster on chromosome 11 (11q12.2-q13.1) includes FADS1, FADS2, and FADS3. FADS1 (Δ5-desaturase) and FADS2 (Δ6-desaturase) are the primary enzymes converting ALA and linoleic acid (LA) downstream.
2.1 Common Polymorphisms and Haplotypes Key single nucleotide polymorphisms (SNPs) in the FADS1/FADS2 locus, often in strong linkage disequilibrium, form major haplotypes associated with altered desaturase activity and blood LC-PUFA levels.
Table 1: Key Polymorphisms in the Human FADS Cluster
| Gene | rsID | Major/Minor Allele | Biochemical Effect | Phenotypic Association |
|---|---|---|---|---|
| FADS1 | rs174537 | G/T | Lower Δ5-activity, reduced ARA | Lower arachidonic acid (ARA) in carriers of T. |
| FADS2 | rs1535 | A/G | Lower Δ6-activity, reduced EPA | Lower EPA from ALA in carriers of G. |
| FADS1/FADS2 | rs174546 | T/C | Modulates both Δ5/Δ6 | Haplotype marker; C allele linked to lower activity. |
| FADS2 | rs3834458 | T/del | Potential splicing effect | Deletion allele associated with lower FADS2 activity. |
2.2 Experimental Protocol: Genotype-Phenotype Association Study
- Objective: Correlate FADS genotypes with erythrocyte membrane fatty acid composition.
- Sample Collection: Obtain venous blood (e.g., 5 mL EDTA) from fasted participants.
- Genotyping: Extract genomic DNA. Perform TaqMan SNP Genotyping Assays (e.g., for rs174537, rs1535) using real-time PCR.
- Phenotyping (Fatty Acid Analysis):
- Isolate erythrocyte membranes via repeated centrifugation and hypotonic lysis.
- Extract total lipids using Folch method (chloroform:methanol, 2:1 v/v).
- Transesterify to Fatty Acid Methyl Esters (FAMEs) with boron trifluoride-methanol.
- Analyze FAMEs via Gas Chromatography with Flame Ionization Detection (GC-FID), using a highly polar capillary column (e.g., CP-Sil 88).
- Quantify peaks against certified external standard mixtures.
- Statistical Analysis: Perform ANOVA or linear regression, modeling fatty acid ratios (e.g., ARA:DGLA for Δ5-activity, EPA:ALA for Δ6-activity) against genotype.
Diagram 1: FADS & ELOVL5 in n-3/n-6 PUFA synthesis.
The ELOVL Family: Isoforms and Tissue Specificity
Seven mammalian ELOVL isoforms (ELOVL1-7) exist, each with distinct substrate preferences and tissue expression patterns crucial for partitioning ALA towards specific LC-PUFA pools.
Table 2: Key ELOVL Isoforms in LC-PUFA Synthesis
| Isoform | Primary Substrate Specificity (PUFA) | Key Tissues | Major Product Role |
|---|---|---|---|
| ELOVL2 | C20 (EPA, 20:5n-3; ARA, 20:4n-6) | Liver, Testis | Critical for synthesis of DPA (22:5n-3) and DHA precursor (24:5n-3). |
| ELOVL5 | C18/C20 (18:4n-3, 18:3n-6; 20:5n-3, 20:4n-6) | Liver, Kidney, Brain | Main elongase upstream of ELOVL2, works with FADS. |
| ELOVL4 | ≥C26 (VLC-PUFA) | Retina, Brain, Skin | Synthesizes ≥C28 PUFA for retinal/photoreceptor function. |
3.2 Experimental Protocol: Tissue-Specific ELOVL Expression Analysis (qRT-PCR)
- Objective: Quantify ELOVL mRNA expression across different human or model organism tissues.
- Tissue Procurement: Snap-freeze tissues (liver, brain, retina, adipose) in liquid N₂.
- RNA Extraction: Homogenize tissue in TRIzol reagent. Isolate total RNA following phase separation with chloroform, precipitation with isopropanol, and washing with 75% ethanol.
- cDNA Synthesis: Treat RNA with DNase I. Synthesize first-strand cDNA using a High-Capacity cDNA Reverse Transcription Kit with random hexamers.
- Quantitative PCR: Use SYBR Green or TaqMan Master Mix. Design isoform-specific primers/probes (e.g., crossing exon-exon junctions). Common reference genes: GAPDH, β-actin, HPRT1.
- Data Analysis: Calculate relative expression (ΔΔCt method), normalizing target gene Ct values to the geometric mean of reference genes in each tissue.
Diagram 2: Tissue-specific ELOVL roles in n-3 LC-PUFA production.
The Scientist's Toolkit: Key Research Reagent Solutions
Table 3: Essential Reagents for FADS/ELOVL Research
| Reagent/Material | Function & Application |
|---|---|
| Certified FAME Standards | Absolute quantification and peak identification in GC analysis of fatty acids. |
| Stable Isotope-Labeled ALA (e.g., 13C-ALA) | Tracer for dynamic studies of enzyme kinetics and metabolic flux in vitro/vivo. |
| Isoform-Specific Antibodies | Western blot detection and localization of FADS/ELOVL proteins in tissues/cells. |
| siRNA/shRNA Libraries (FADS1/2, ELOVL2/5/4) | Knockdown studies to delineate isoform-specific functions in cell models. |
| Genetically Modified Cell Lines (e.g., HEK293 overexpressing FADS1) | Controlled systems for studying enzyme activity or testing pharmaceutical modulators. |
| TaqMan SNP Genotyping Assays | Accurate, high-throughput genotyping of FADS cluster polymorphisms. |
| Polar Capillary GC Columns (e.g., CP-Sil 88, SP-2560) | Separation of geometric and positional isomers of unsaturated FAMEs. |
Integrated Workflow for Pathway Analysis
Protocol: Combined Genotyping, Transcriptomics, and Lipidomics in a Cell Model.
- Cell Culture & Treatment: Culture HepG2 or primary human hepatocytes. Treat with ALA (100 µM) and/or a pharmacological agent (e.g., a putative desaturase modulator) for 24-72 hours.
- DNA/RNA Extraction: Use a kit that allows sequential isolation of genomic DNA and total RNA (e.g., AllPrep DNA/RNA/miRNA Kit).
- Genotyping: Perform FADS SNP analysis on gDNA as in Section 2.2.
- Gene Expression: Analyze FADS1, FADS2, ELOVL2, ELOVL5 mRNA via qRT-PCR as in Section 3.2.
- Lipid Extraction & Analysis: Extract cellular lipids and analyze fatty acid profile via GC-FID/GC-MS as in Section 2.2.
- Data Integration: Correlate genotype (e.g., rs174537), gene expression fold-change, and product/precursor ratios (e.g., EPA/ALA) using multivariate statistics.
Diagram 3: Integrated workflow for FADS/ELOVL study.
Within the broader context of ALA metabolism pathway desaturase and elongase enzymes research, this whitepaper details the enzymatic conversion of α-linolenic acid (ALA; 18:3n-3) to long-chain omega-3 polyunsaturated fatty acids (LC-PUFAs). The pathway's efficiency, governed by rate-limiting desaturation steps, is a critical focus for therapeutic intervention and nutritional science.
The endogenous synthesis of eicosapentaenoic acid (EPA) and docosahexaenoic acid (DHA) from the essential fatty acid ALA occurs via a series of alternating elongation and desaturation reactions in the endoplasmic reticulum, primarily within the liver. This pathway is characterized by competitive kinetics with the omega-6 PUFA pathway and is highly regulated by genetic, dietary, and hormonal factors.
The Enzymatic Cascade: A Step-by-Step Breakdown
The conversion follows a conserved "Sprecher" pathway for DHA synthesis.
2.1 Initial Conversion in the ER
- Δ6-desaturation: ALA (18:3n-3) is converted to stearidonic acid (SDA; 18:4n-3) by the rate-limiting enzyme Δ6-desaturase (FADS2).
- Elongation 1: SDA (18:4n-3) is elongated to eicosatetraenoic acid (ETA; 20:4n-3) by the elongase of very long-chain fatty acids 5 (ELOVL5).
- Δ5-desaturation: ETA (20:4n-3) is desaturated to EPA (20:5n-3) by Δ5-desaturase (FADS1).
2.2 The Sprecher Pathway for DHA Synthesis
- Elongation 2: EPA (20:5n-3) is elongated to docosapentaenoic acid (DPA; 22:5n-3) by ELOVL5 or ELOVL2.
- Elongation 3: DPA (22:5n-3) is further elongated to tetracosapentaenoic acid (24:5n-3) by ELOVL2.
- Δ6-desaturation (on C24): 24:5n-3 is desaturated to tetracosahexaenoic acid (24:6n-3) by FADS2 in the ER.
- Peroxisomal β-oxidation: 24:6n-3 is translocated to peroxisomes, where one cycle of β-oxidation removes two carbons, yielding final DHA (22:6n-3).
Table 1: Enzymatic Kinetics of Human PUFA Metabolism
| Enzyme (Gene) | Preferred Substrate (n-3) | Km (μM) Approx. | Vmax Relative | Tissue Expression (Primary) |
|---|---|---|---|---|
| Δ6-desaturase (FADS2) | ALA (18:3n-3) | 10-30 | 1.0 (Reference) | Liver, Brain, Breast |
| ELOVL5 | SDA (18:4n-3) | 5-15 | High | Liver, Testis, Kidney |
| Δ5-desaturase (FADS1) | ETA (20:4n-3) | 15-40 | 2.5-3.5* | Liver, Adrenal, Heart |
| ELOVL2 | EPA (20:5n-3)/DPA (22:5n-3) | 1.5-5.0 | Moderate | Liver, Testis, Retina |
*Relative to FADS2 activity on ALA. Data compiled from recent heterologous expression studies and tracer analyses.
Table 2: Typical Conversion Efficiencies in Humans
| Metabolic Step | Estimated Conversion Efficiency (%)* | Key Regulatory Influence |
|---|---|---|
| ALA → SDA (Δ6D) | < 10% | Rate-limiting, strongly inhibited by high LA (18:2n-6) |
| SDA → ETA (ELOVL5) | > 80% | High substrate affinity |
| ETA → EPA (Δ5D) | 60-80% | Less rate-limiting than Δ6D |
| EPA → DPA (ELOVL2/5) | 30-50% | Efficient |
| DPA → DHA (Full) | < 5-10% | Limited by peroxisomal trafficking & oxidation |
| Overall ALA → DHA | < 0.5-4% | Sex (F>M), Hormonal Status, FADS SNP |
*Efficiencies vary widely based on methodology (tracer vs. dietary dose) and population.
Key Experimental Protocols
Protocol 1: In Vitro Enzyme Activity Assay using Stable Isotope Tracers
- Objective: Measure the kinetic parameters (Km, Vmax) of FADS2 or FADS1.
- Methodology:
- Cell System: Transfect HEK293 or HepG2 cells with human FADS2 or FADS1 expression vector.
- Tracer Incubation: Supplement culture medium with [U-¹³C]-ALA (for FADS2) or [U-¹³C]-ETA (for FADS1) across a concentration range (e.g., 5-100 μM).
- Lipid Extraction: After 24h, harvest cells and extract total lipids via Folch method (CHCl₃:MeOH, 2:1 v/v).
- Derivatization & Analysis: Convert fatty acids to methyl esters (FAMEs) using BF₃/MeOH. Analyze via GC-MS equipped with a highly polar capillary column (e.g., CP-Sil 88).
- Data Calculation: Quantify ¹³C enrichment in product (SDA or EPA) and substrate. Calculate enzymatic velocity. Fit data to Michaelis-Menten model using non-linear regression.
Protocol 2: In Vivo Metabolic Flux Analysis
- Objective: Determine whole-body conversion rates of ALA to EPA and DHA.
- Methodology:
- Tracer Administration: Orally administer a bolus of deuterated (²H₅)-ALA (e.g., 50 mg/kg) to human volunteers or animal models.
- Serial Blood Sampling: Collect plasma at baseline, 2, 4, 8, 12, 24, 48, 72, and 96h post-dose.
- Plasma Lipid Separation: Isolate phospholipid fraction via solid-phase extraction (SPE) to reflect structural lipid incorporation.
- GC-MS Analysis: Generate FAMEs and analyze for ²H-enrichment in ALA, SDA, EPA, DPA, and DHA.
- Compartmental Modeling: Use kinetic modeling software (e.g., SAAM II) to calculate flux rates (ρ) through each step of the pathway.
Pathway Visualizations
Diagram 1: The complete n-3 PUFA biosynthetic pathway.
Diagram 2: Workflow for in vivo metabolic flux analysis.
The Scientist's Toolkit: Research Reagent Solutions
Table 3: Essential Reagents and Materials for Pathway Research
| Item | Function/Application | Example/Note |
|---|---|---|
| Stable Isotope Tracers | Quantitative metabolic flux analysis in vitro & in vivo. | [U-¹³C]-ALA, [²H₅]-EPA, [¹³C]-DHA. Must be >98% isotopic purity. |
| FADS2/FADS1/ELOVL Expression Vectors | Heterologous expression for functional characterization. | Human ORF clones in pcDNA3.1 or lentiviral vectors for stable line generation. |
| PUFA Analytical Standards | GC-MS/FAME identification and quantification. | Nu-Chek Prep GLC reference mixtures (ALA, SDA, ETA, EPA, DPA, DHA). |
| Specialized GC Columns | Separation of geometric and positional PUFA isomers. | Highly polar cyanopropyl columns (e.g., CP-Sil 88, SP-2560). |
| Fatty Acid Methylation Kits | Preparation of volatile FAMEs for GC analysis. | BF₃ in methanol (12-14% w/v) or methanolic HCl kits under inert atmosphere. |
| Lipid Extraction Solvents | Total lipid extraction from cells/tissues/plasma. | Chloroform:MeOH (2:1, Folch method). Use HPLC-grade with antioxidant (BHT). |
| Silica SPE Cartridges | Fractionation of lipid classes (e.g., PLs, TGs, CEs). | 500 mg/3 mL cartridges for isolating phospholipids for pathway analysis. |
| Δ6/Δ5 Desaturase Activity Assay Kits | Colorimetric/fluorimetric screening of enzyme activity. | Cell-based kits measuring product/substrate ratio via coupled enzymes. |
The metabolic conversion of alpha-linolenic acid (ALA, 18:3n-3) to long-chain polyunsaturated fatty acids (LC-PUFAs) such as eicosapentaenoic acid (EPA; 20:5n-3), docosapentaenoic acid (DPA; 22:5n-3), and docosahexaenoic acid (DHA; 22:6n-3) is a critical biochemical pathway in human physiology. This whitepaper frames this conversion within the broader thesis of ALA metabolism pathway research, focusing on the rate-limiting desaturase (FADS1, FADS2) and elongase (ELOVL2, ELOVL5) enzymes. The endogenous synthesis of these LC-PUFAs, though limited in humans, is indispensable for neurological development, retinal function, inflammatory resolution, and cellular membrane integrity. Dysregulation of this pathway, driven by genetic polymorphisms, dietary imbalances, or disease states, is implicated in a spectrum of chronic conditions, making it a pivotal target for therapeutic intervention and nutritional strategy.
Biosynthetic Pathway and Enzymatic Regulation
ALA is converted to EPA and DHA via a series of elongation and desaturation reactions. The pathway is primarily hepatic and is tightly regulated by the transcriptional control of enzyme genes.
Key Enzymes:
- Δ-6-desaturase (FADS2): Catalyzes the first, rate-limiting step: ALA → Stearidonic acid (SDA; 18:4n-3).
- Elongase 5 (ELOVL5): Elongates SDA to Eicosatetraenoic acid (ETA; 20:4n-3).
- Δ-5-desaturase (FADS1): Desaturates ETA to EPA (20:5n-3).
- Elongase 2 (ELOVL2): Crucial for the elongation of EPA to DPA (22:5n-3) and the subsequent intermediate for DHA synthesis.
- Peroxisomal β-oxidation: Final step to produce DHA from 24:6n-3.
The efficiency of this pathway in humans is low, with average conversion rates of <1% for ALA to DHA. This inefficiency underscores the physiological significance of the LC-PUFAs produced and their frequent designation as conditionally essential.
Quantitative Data on Conversion Efficiency and Tissue Distribution
Table 1: Estimated Endogenous Conversion Efficiency of ALA to LC-PUFAs in Humans
| Precursor | Product | Average Conversion Rate (%) | Key Influencing Factors |
|---|---|---|---|
| ALA | EPA | 0.2 – 8.0 | High ALA intake, FADS1 polymorphism, gender (higher in women) |
| ALA | DPA | ~0.1 – 1.0 | ELOVL2 activity, peroxisomal function |
| ALA | DHA | <0.1 – 0.5 | ELOVL2/5 activity, age (declines with age), dietary LA:ALA ratio |
| EPA | DHA | ~0.1 – 1.0 | Primarily limited by ELOVL2 elongation step |
Table 2: LC-PUFA Composition in Select Human Tissues (Weight % of Total Phospholipids)
| Tissue | DHA | EPA | ARA (Arachidonic Acid) | Physiological Role |
|---|---|---|---|---|
| Cerebral Cortex | 12-15% | <1% | 10-12% | Neuronal membrane fluidity, synaptogenesis |
| Retina (Photoreceptors) | 30-50% | Trace | 10-15% | Phototransduction, disk membrane renewal |
| Cardiac Muscle | 2-4% | 0.5-1.5% | 10-15% | Membrane excitability, energy metabolism |
| Spermatozoa | 15-20% | 1-2% | 5-8% | Membrane fusion, motility |
Physiological Roles and Mechanisms in Health
- Neural & Visual Development: DHA is a critical structural component of neuronal and retinal photoreceptor membranes, constituting over 30% of photoreceptor phospholipids. It modulates synaptic protein function, neurogenesis, and the visual cycle.
- Inflammation & Resolution: EPA serves as a competitive substrate with arachidonic acid (ARA) for cyclooxygenase and lipoxygenase enzymes, yielding less potent eicosanoids (e.g., series-3 prostaglandins). Both EPA and DHA are precursors to specialized pro-resolving mediators (SPMs—resolvins, protectins, maresins) that actively terminate inflammatory responses.
- Cellular Signaling & Gene Expression: LC-PUFAs regulate transcription factors such as PPAR-α/γ, SREBP-1c, and NF-κB, influencing genes involved in lipid metabolism, inflammation, and insulin sensitivity.
- Membrane Dynamics: Incorporated into phospholipid bilayers, DHA and EPA increase membrane fluidity, affect lipid raft formation, and modulate the function of embedded receptors and ion channels.
Implications in Disease Pathogenesis
- Neurodegenerative Diseases (Alzheimer's, Parkinson's): Post-mortem brain studies show depleted DHA levels. DHA deficiency impairs synaptic plasticity, promotes amyloid-β production, and increases neuroinflammation.
- Cardiovascular Disease: Low EPA/DHA status correlates with hypertriglyceridemia, increased platelet aggregation, endothelial dysfunction, and elevated risk of arrhythmia. EPA's cardioprotective effects are partially independent of lipid-lowering.
- Inflammatory & Autoimmune Disorders (RA, IBD): An imbalanced ARA:EPA ratio favors a pro-inflammatory eicosanoid profile. Inadequate SPM production leads to chronic, non-resolving inflammation.
- Psychiatric Conditions (Major Depression): Meta-analyses link low erythrocyte DHA/EPA levels with depression severity. LC-PUFAs modulate serotonin neurotransmission and hypothalamic-pituitary-adrenal axis activity.
- Metabolic Syndrome: Impaired desaturase activity (low FADS1) is associated with insulin resistance, hepatic steatosis, and dyslipidemia.
Detailed Experimental Protocols
Protocol 1: In Vitro Assay for Δ-6-Desaturase (FADS2) Activity Objective: Measure the conversion of radiolabeled ALA to SDA in a recombinant cell system. Methodology:
- Cell Transfection: Transfect HEK-293 cells (low endogenous desaturase activity) with a human FADS2 expression vector or empty vector control.
- Substrate Incubation: At 48h post-transfection, incubate cells with 0.1 µM [1-¹⁴C]ALA (specific activity 50-60 mCi/mmol) in serum-free medium containing 0.1% fatty acid-free BSA for 6h.
- Lipid Extraction: Wash cells with PBS, scrape, and extract total lipids via Folch method (2:1 chloroform:methanol).
- Analysis: Separate lipid extracts by thin-layer chromatography (TLC) on silica gel G plates using a hexane:diethyl ether:acetic acid (70:30:1, v/v/v) solvent system. Identify bands corresponding to ALA and SDA using authentic standards.
- Quantification: Scrape bands and measure radioactivity by liquid scintillation counting. Activity expressed as pmol of SDA formed per mg of cellular protein per hour.
Protocol 2: Targeted Lipidomics for Tissue LC-PUFA Profiling Objective: Quantify specific LC-PUFA species in tissue biopsies. Methodology:
- Sample Preparation: Homogenize 10-20 mg of frozen tissue in ice-cold PBS. Spike with internal standards (e.g., d₅-ARA, d₅-EPA, d₅-DHA).
- Lipid Extraction: Perform a modified Bligh & Dyer extraction. Derivatize fatty acids to fatty acid methyl esters (FAMEs) using boron trifluoride-methanol.
- LC-MS/MS Analysis: Inject FAME extracts onto a reversed-phase C18 column (2.1 x 100 mm, 1.7 µm). Use a gradient elution with water (A) and acetonitrile (B), both with 0.1% formic acid.
- Detection: Operate a triple quadrupole mass spectrometer in multiple reaction monitoring (MRM) mode, monitoring specific precursor→product ion transitions for each FAME.
- Data Analysis: Quantify using stable isotope dilution. Normalize values to tissue weight or total protein content.
Signaling Pathways and Metabolic Workflow
Diagram Title: ALA to DHA Biosynthetic Pathway with Key Enzymes
Diagram Title: LC-PUFA Mediated Eicosanoid and SPM Biosynthesis
The Scientist's Toolkit: Essential Research Reagents & Materials
Table 3: Key Reagent Solutions for ALA/LC-PUFA Research
| Reagent/Material | Function & Application | Key Considerations |
|---|---|---|
| Stable Isotope-Labeled Tracers (e.g., [U-¹³C]ALA, d₅-EPA) | Precise quantification of metabolic flux and conversion rates in in vivo and in vitro models using GC-MS or LC-MS. | Enables kinetic modeling. Choose isotope position (carboxyl vs. methyl end) based on study objective. |
| Recombinant Human Desaturase/Elongase Enzymes | For high-throughput screening of potential enzyme inhibitors or activators in cell-free assays. | Purified protein systems remove confounding cellular metabolism. |
| FADS1/FADS2/ELOVL2 siRNA/shRNA Kits | To knockdown endogenous enzyme expression and study functional consequences on lipid profiles and cellular phenotypes. | Validated sequences and efficient delivery (e.g., lipid nanoparticles) are critical. |
| Specialized Pro-Resolving Mediator (SPM) Standards (RvD1, RvE1, MaR1, PD1) | Identification and quantification of bioactive metabolites via LC-MS/MS in biological samples (serum, tissue, exudates). | Essential for studying inflammation resolution. Requires sensitive MS methods. |
| Fatty Acid-Free Bovine Serum Albumin (BSA) | Carrier for solubilizing and delivering hydrophobic fatty acids (ALA, EPA, DHA) to cell culture media. | Prevents fatty acid toxicity and ensures even delivery. Must be essentially fatty acid-free. |
| LC-PUFA-Enriched Phospholipid Liposomes | Model membrane systems to study the biophysical effects (fluidity, raft formation) of incorporated DHA/EPA. | Control over lipid composition and particle size is necessary. |
| PPAR/NF-κB Reporter Assay Kits | To measure the transcriptional activity of LC-PUFA-sensitive nuclear receptors and transcription factors. | Standardized luciferase-based systems for high-throughput screening. |
| Genotyping Arrays for FADS Cluster SNPs (e.g., rs174537, rs174546) | To stratify human subjects or cell lines by inherent metabolic capacity for LC-PUFA synthesis. | Crucial for nutrigenetics and personalized health studies. |
Experimental Strategies: Analyzing Desaturase and Elongase Activity in Research Models
This technical guide details in vitro methodologies essential for characterizing the enzymes of the alpha-linolenic acid (ALA) metabolism pathway, specifically the Δ-6 desaturase (FADS2), Δ-5 desaturase (FADS1), and elongase (ELOVL2, ELOVL5) enzymes. Understanding their kinetics, substrate specificity, and inhibition profiles is critical for research into lipidomics, inflammatory diseases, and therapeutic development targeting polyunsaturated fatty acid (PUFA) synthesis.
Core Experimental Principles
Enzyme Kinetic Parameters
Enzyme kinetics in this context measure the rate of fatty acid conversion. The Michaelis-Menten model is foundational:
V₀ = (V_max * [S]) / (K_m + [S])
Where V₀ is initial velocity, V_max is maximum velocity, [S] is substrate concentration, and K_m is the Michaelis constant (substrate affinity). For membrane-bound desaturases/elongases, assays utilize microsomal fractions or recombinant enzymes in membrane-mimetic systems.
Substrate Preference (Specificity Constant)
The specificity constant (k_cat / K_m) determines catalytic efficiency for competing substrates (e.g., linoleic acid (LA) vs. ALA for FADS2). A higher value indicates preferred substrate utilization.
Inhibition Modes
Inhibitors can be competitive (binds active site), non-competitive (binds enzyme-substrate complex), or uncompetitive (binds only enzyme-substrate complex). Analysis via Lineweaver-Burk plots is standard.
Experimental Protocols
Microsomal Preparation for Desaturase/Elongase Assays
Objective: Isolate active enzyme fractions from cultured cells or tissue.
- Homogenization: Suspend cell pellet or tissue in ice-cold homogenization buffer (0.25 M sucrose, 10 mM HEPES pH 7.4, 1 mM EDTA, protease inhibitors). Homogenize using a Dounce homogenizer (30 strokes).
- Differential Centrifugation:
- Centrifuge at 10,000 x g for 10 min at 4°C. Retain supernatant.
- Centrifuge supernatant at 100,000 x g for 60 min at 4°C.
- Microsomal Pellet: Resuspend the resulting pellet (microsomes) in storage buffer (50 mM Tris-HCl pH 7.4, 0.25 M sucrose, 1 mM DTT). Aliquot, flash-freeze in liquid N₂, store at -80°C.
- Protein Quantification: Determine protein concentration using a Bradford or BCA assay.
Standard Radiolabeled Enzyme Activity Assay
Objective: Measure conversion of radiolabeled substrate to product.
- Reaction Mix: In a glass tube, combine:
- 100-200 µg microsomal protein.
- 50 mM Tris-HCl buffer, pH 7.4.
- 1 mM NADH.
- 1 mM ATP.
- 0.5 mM Coenzyme A.
- 5 mM MgCl₂.
- [1-¹⁴C]-labeled substrate (e.g., 18:3n-3, ALA) at varying concentrations (5-100 µM). Specific activity ~0.05 µCi/nmol.
- Incubation: Adjust final volume to 1 mL. Incubate at 37°C for 5-15 min in a shaking water bath. Start reaction by adding microsomes.
- Reaction Termination: Stop by adding 2 mL of 10% KOH in methanol.
- Lipid Extraction & Analysis:
- Saponify at 80°C for 60 min.
- Acidify with HCl, extract fatty acids with hexane.
- Derivatize to methyl esters (FAMEs) using BF₃/methanol.
- Separate FAMEs by reverse-phase HPLC coupled to a radioactive flow detector or by Ag⁺-TLC. Identify peaks using unlabeled standards.
- Calculation: Activity = (Product radioactivity / total radioactivity) / (time * protein amount). Convert to nmol/min/mg.
LC-MS/MS-Based Activity Assay (Non-Radiometric)
Objective: Quantify unlabeled substrate depletion and product formation using mass spectrometry.
- Reaction: Conduct as in 3.2, but with unlabeled substrates.
- Termination & Extraction: Stop with 2 mL ice-cold methanol containing internal standards (e.g., d₅-ARA). Extract lipids via Folch or Bligh & Dyer method.
- Analysis: Analyze fatty acids or their methyl esters by LC-ESI-MS/MS. Use Multiple Reaction Monitoring (MRM) for specific quantification.
- Advantages: Avoids radioactivity, enables multiplex substrate profiling.
Inhibition Assay Protocol
Objective: Determine IC₅₀ and inhibition mode.
- Set up standard activity assays (3.2 or 3.3) with a fixed, near-Km concentration of substrate.
- Include increasing concentrations of the test inhibitor (e.g., a small-molecule desaturase inhibitor) dissolved in DMSO (final [DMSO] ≤ 0.5% v/v).
- Measure residual activity.
- IC₅₀ Determination: Fit data to log(inhibitor) vs. response (variable slope) model:
Activity = Bottom + (Top-Bottom)/(1+10^((LogIC₅₀-X)*HillSlope)). - Mode Determination: Perform full kinetic assays at multiple inhibitor concentrations. Plot Lineweaver-Burk (1/v vs. 1/[S]) or fit data globally to competitive, non-competitive, or uncompetitive models using software (e.g., GraphPad Prism, EnzymeKinetics).
Data Presentation
Table 1: Representative Kinetic Parameters for Human ALA Pathway Enzymes
| Enzyme (Gene) | Preferred Substrate | Apparent K_m (µM) | V_max (nmol/min/mg protein) | k_cat (min⁻¹) * | kcat/Km (µM⁻¹min⁻¹) | Key Product |
|---|---|---|---|---|---|---|
| Δ-6 Desaturase (FADS2) | α-Linolenic Acid (ALA, 18:3n-3) | 12.5 ± 2.1 | 0.85 ± 0.11 | 0.51 | 0.041 | Stearidonic Acid (18:4n-3) |
| Δ-6 Desaturase (FADS2) | Linoleic Acid (LA, 18:2n-6) | 18.3 ± 3.4 | 1.12 ± 0.15 | 0.67 | 0.037 | γ-Linolenic Acid (GLA, 18:3n-6) |
| Elongase 5 (ELOVL5) | 18:4n-3 | 5.8 ± 0.9 | 2.40 ± 0.30 | 1.44 | 0.248 | 20:4n-3 |
| Δ-5 Desaturase (FADS1) | 20:4n-3 | 8.2 ± 1.5 | 1.80 ± 0.22 | 1.08 | 0.132 | Eicosapentaenoic Acid (EPA, 20:5n-3) |
| Elongase 2 (ELOVL2) | EPA (20:5n-3) | 3.5 ± 0.7 | 1.05 ± 0.18 | 0.63 | 0.180 | Docosapentaenoic Acid (DPA, 22:5n-3) |
Note: k_cat calculated assuming a molecular weight of ~55 kDa for desaturases. Values are illustrative from recent literature.
Table 2: Example Inhibitor Profiles for FADS2
| Inhibitor Name/Structure | IC₅₀ (µM) | Inhibition Mode | Selectivity (vs. FADS1) | Assay Type |
|---|---|---|---|---|
| SC-26196 | 0.15 ± 0.03 | Competitive | >100-fold | Microsomal, ¹⁴C-ALA |
| Compound XYZ (Pyridazinone) | 0.8 ± 0.2 | Non-competitive | 5-fold | Recombinant, LC-MS/MS |
| Abietic Acid derivative | 12.5 ± 3.1 | Uncompetitive | Not determined | Cell-based, GC-FID |
Visualizations
Title: ALA to DHA Metabolic Pathway Enzymology
Title: In Vitro Desaturase/Elongase Assay Workflow
Title: Enzyme Inhibition Mode Graphical Analysis
The Scientist's Toolkit: Research Reagent Solutions
| Item | Function/Application in Desaturase/Elongase Assays | Example Product/Source |
|---|---|---|
| [1-¹⁴C]-Labeled Fatty Acids | Radiolabeled substrates (e.g., [1-¹⁴C]-ALA, LA) for sensitive detection of enzymatic conversion in microsomal assays. | American Radiolabeled Chemicals, PerkinElmer |
| Deuterated Internal Standards (d₅-ARA, d₅-EPA) | Essential for accurate quantification in LC-MS/MS assays; corrects for extraction and ionization variability. | Cayman Chemical, Avanti Polar Lipids |
| NADH/NADPH Regenerating Systems | Provides reducing equivalents required for desaturase and elongase reactions. Maintains cofactor concentration. | Sigma-Aldrich, Promega |
| Acyl-CoA Synthetase & Acyl-CoA Substrates | For assays using acyl-CoA esters instead of free fatty acids. May reflect the in vivo substrate form. | Avanti Polar Lipids, Sigma-Aldrich |
| Membrane Protein Stabilizers | Detergents (CHAPS, n-Dodecyl β-D-maltoside) or lipids (PC vesicles) to solubilize and maintain activity of recombinant enzymes. | Anatrace, Avanti Polar Lipids |
| Specific Chemical Inhibitors | Tool compounds for validating assay function and studying inhibition (e.g., SC-26196 for FADS2). | Tocris, Cayman Chemical |
| Fatty Acid-Free BSA | Binds free fatty acids, helps solubilize substrates in aqueous reaction buffers, prevents non-specific adsorption. | Sigma-Aldrich |
| Ag⁺-TLC Plates | Separates fatty acid methyl esters (FAMEs) based on double bond number. Classic method for product resolution. | Analtech, Sigma-Aldrich |
| C18 Reverse-Phase HPLC/UPLC Columns | Core for separating complex FAME or free fatty acid mixtures prior to detection (radio or MS). | Waters, Agilent, Phenomenex |
| Kinetic Analysis Software | For global fitting of kinetic and inhibition data to appropriate models (Michaelis-Menten, IC₅₀, mode). | GraphPad Prism, SigmaPlot, EnzymeKinetics |
This technical guide details the application of core cell culture models—HepG2, HEK293, and primary neuronal cells—within the specific context of research on the ALA (alpha-linolenic acid) metabolism pathway, focusing on desaturase (FADS1, FADS2) and elongase (ELOVL2, ELOVL5) enzymes. These models are indispensable for elucidating enzyme function, regulatory mechanisms, and metabolic flux in polyunsaturated fatty acid (PUFA) biosynthesis, with direct implications for drug development targeting metabolic and neurological disorders.
Cell Line Characteristics and Selection
Selection of the appropriate cell model is critical for pathway-specific research.
Table 1: Comparative Characteristics of Cell Models for ALA Metabolism Studies
| Cell Model | Origin | Key Advantages for ALA Pathway Studies | Primary Transfection Method | Endogenous PUFA Enzyme Expression |
|---|---|---|---|---|
| HepG2 | Human hepatocarcinoma | Relevant model for hepatic lipid metabolism; expresses baseline FADS2 & ELOVL5 | Lipid-based (e.g., Lipofectamine 3000) | Moderate FADS2, Low FADS1, High ELOVL5 |
| HEK293 | Human embryonic kidney | High transfection efficiency; low background metabolism; ideal for heterologous expression | PEI (Polyethylenimine) or Calcium Phosphate | Very Low/Negligible |
| Primary Neuronal Cells | Rat/mouse cortex or hippocampus | Physiologically relevant for studying neuronal membrane lipid composition & brain PUFA synthesis | Electroporation or Lentiviral transduction | Variable; depends on developmental stage |
Experimental Protocols
Transfection for Overexpression (HEK293 Example)
This protocol is optimized for overexpressing human FADS1 cDNA in HEK293 cells to study Δ5-desaturase activity.
- Day 1: Seed HEK293 cells in a 6-well plate at 3.5 x 10^5 cells/well in DMEM + 10% FBS.
- Day 2 (Transfection): For each well, prepare two tubes:
- Tube A: Dilute 2.5 µg plasmid DNA in 150 µL Opti-MEM I Reduced Serum Medium.
- Tube B: Dilute 6.5 µL PEI reagent (1 mg/mL) in 150 µL Opti-MEM. Incubate 5 min.
- Combine Tube A and B, mix gently, incubate 20 min at RT.
- Add DNA-PEI complex dropwise to cells with fresh medium.
- Day 3: Replace medium with DMEM + 10% FBS.
- Day 4: Harvest cells for RNA/protein analysis or supplement medium with 100 µM ALA for 48h for fatty acid analysis via GC-MS.
siRNA-Mediated Knockdown (HepG2 Example)
Protocol for knocking down ELOVL5 in HepG2 cells to study elongase function.
- Day 1: Seed HepG2 cells in 12-well plate at 1.5 x 10^5 cells/well in antibiotic-free EMEM + 10% FBS.
- Day 2 (Transfection): For each well:
- Dilute 25 pmol ON-TARGETplus Human ELOVL5 siRNA (or Non-targeting control) in 100 µL Opti-MEM.
- Dilute 3 µL Lipofectamine RNAiMAX in 100 µL Opti-MEM. Incubate 5 min.
- Combine dilutions, incubate 20 min at RT.
- Add complexes to cells.
- Day 3: Replace transfection medium.
- Day 5: Harvest cells. Knockdown efficiency (>70%) should be confirmed by qRT-PCR (primers: ELOVL5 F:5’-GGCCTTCGTGACTTCATCCT-3’, R:5’-AGCACCTTGGTGAAGGTGAC-3’).
Lentiviral Transduction of Primary Cortical Neurons
For stable overexpression or knockdown in post-mitotic neurons.
- Day 1: Plate primary rat cortical neurons (E18) on poly-D-lysine-coated plates in Neurobasal + B27.
- Day 4-6 (Transduction): Add lentiviral particles (e.g., expressing shRNA against Fads2 or a scrambled control) at an MOI of 5-10 in the presence of 6 µg/mL polybrene.
- Day 5: Completely replace medium with fresh Neurobasal + B27.
- Day 10-12: Assay for transduction efficiency (via GFP reporter) and perform functional assays with ALA supplementation.
Key Analytical Assays
Following transfection/transduction, these assays are essential:
- qRT-PCR: Quantify mRNA levels of FADS1, FADS2, ELOVL2, ELOVL5.
- Western Blot: Detect protein expression using validated antibodies.
- GC-MS (Gas Chromatography-Mass Spectrometry): The gold standard for quantifying PUFA levels (e.g., 18:3n-3, 20:5n-3, 22:6n-3) in cell lipids post-treatment with ALA substrate.
- LC-MS/MS (Liquid Chromatography-Tandem Mass Spectrometry): For sensitive detection of enzymatic products and lipid mediators.
Table 2: Typical Transfection Efficiency and Knockdown Efficacy Data
| Cell Model | Method | Target | Typical Efficiency (Quantitative Readout) | Assay Timepoint Post-Transfection |
|---|---|---|---|---|
| HEK293 | PEI Overexpression | FADS1 cDNA | 80-95% (Protein by WB) | 48-72 hours |
| HepG2 | Lipid siRNA | ELOVL5 mRNA | 70-85% (mRNA by qPCR) | 72-96 hours |
| Cortical Neurons | Lentiviral shRNA | Fads2 mRNA | 60-80% (mRNA by qPCR) | 10-14 days |
Signaling Pathways & Experimental Workflows
Diagram 1: Core Workflow for ALA Pathway Manipulation (87 chars)
Diagram 2: ALA to DHA Metabolic Pathway Enzymes (72 chars)
The Scientist's Toolkit: Research Reagent Solutions
Table 3: Essential Reagents for Transfection and ALA Metabolism Studies
| Reagent/Material | Function in ALA Pathway Studies | Example Product/Catalog |
|---|---|---|
| Lipofectamine 3000 | Lipid-based transfection of plasmid DNA or siRNA into HepG2 & HEK293 cells. | Thermo Fisher, L3000015 |
| PEI (Polyethylenimine) | High-efficiency, low-cost transfection of plasmid DNA into HEK293 cells. | Polysciences, 23966-2 |
| Lipofectamine RNAiMAX | Optimized for siRNA delivery with high knockdown efficiency and low cytotoxicity. | Thermo Fisher, 13778150 |
| Lentiviral Packaging Mix | Production of lentiviral particles for stable gene modulation in neuronal cells. | Origene, TR30037 |
| Poly-D-Lysine | Coating substrate for improved adhesion and growth of primary neuronal cultures. | Sigma, P6407 |
| ALA Sodium Salt | Defined substrate for the metabolic pathway; added to serum-free or BSA-conjugated media. | Cayman Chemical, 90260 |
| B27 Supplement | Serum-free supplement essential for long-term viability of primary neuronal cultures. | Thermo Fisher, 17504044 |
| ON-TARGETplus siRNA | SMARTpool siRNA for specific, off-target-effect minimized knockdown of human genes. | Horizon, L-005089-00-0005 (ELOVL5) |
| Validated Antibodies (FADS2) | Western blot confirmation of target protein expression or knockdown. | Santa Cruz, sc-393902 |
| Fatty Acid-Free BSA | Used to conjugate and deliver free fatty acids (ALA) to cells in culture. | Sigma, A7030 |
This whitepaper details the application of transgenic murine models in elucidating the roles of Δ6-desaturase (FADS2) and long-chain fatty acid elongases (ELOVL2, ELOVL5) within the α-linolenic acid (ALA) metabolism pathway. Framed within a broader thesis on desaturase and elongase enzyme research, it provides a technical guide for employing genetic and dietary interventions to study polyunsaturated fatty acid (PUFA) biosynthesis, tissue lipid profiles, and associated physiological outcomes.
The metabolism of ALA (18:3n-3) to long-chain PUFAs like eicosapentaenoic acid (EPA; 20:5n-3) and docosahexaenoic acid (DHA; 22:6n-3) is governed by sequential desaturation and elongation steps. Key enzymes include:
- FADS2 (Δ6-desaturase): Catalyzes the initial, rate-limiting desaturation of ALA to stearidonic acid (SDA; 18:4n-3).
- ELOVL5 (elongase 5): Primarily elongates C18 and C20 PUFAs (e.g., SDA to 20:4n-3).
- ELOVL2 (elongase 2): Primarily elongates C20 and C22 PUFAs (e.g., EPA to 22:5n-3).
Transgenic Mouse Models: Generation and Validation
Fads2Knockout (KO) Model
Purpose: To create a complete deficit in Δ6-desaturase activity, mimicking impaired endogenous LC-PUFA synthesis. Protocol (CRISPR-Cas9 Mediated KO):
- gRNA Design: Design two single-guide RNAs (sgRNAs) targeting exons 2-4 of the murine Fads2 gene.
- Microinjection: Co-inject Cas9 mRNA and sgRNAs into C57BL/6J zygotes.
- Genotyping: Screen founders via PCR of tail genomic DNA. Use primers flanking the target site. Successful KO results in a larger amplicon (indel) or a smaller one (large deletion) compared to wild-type (WT).
- Biochemical Validation: Confirm phenotype by analyzing liver phospholipid fatty acids via GC-MS. Expect near-absence of Δ6-desaturase products (e.g., 18:4n-3, 20:4n-6) and accumulation of substrates (ALA, LA).
Elovl2andElovl5Overexpression Models
Purpose: To enhance specific elongation steps and study the impact on LC-PUFA pools, particularly DHA synthesis. Protocol (Tetracycline-Inducible, Liver-Specific Overexpression):
- Transgene Construct: Clone murine Elovl2 or Elovl5 cDNA downstream of a TRE (tet-response element) promoter. Use the LAP-tTA driver line (liver-specific activator).
- Mouse Line Generation: Microinject the linearized construct into fertilized oocytes. Cross founders with LAP-tTA mice.
- Induction: Administer doxycycline (2 mg/mL in sucrose water) for 2 weeks to induce transgene expression. Include control groups on normal water.
- Validation: Quantify transgene mRNA via liver qRT-PCR (TaqMan probes). Confirm functional overexpression by analyzing liver and plasma lipidomes for increased product/substrate ratios (e.g., 22:5n-3/20:5n-3 for ELOVL2).
Dietary Modulation Studies: Standard Protocols
Diets are used in conjunction with genetic models to modulate substrate availability.
Table 1: Standardized Semi-Purified Diet Formulations
| Diet Name | Fat Source Composition | Key Fatty Acid Traits | Primary Research Question |
|---|---|---|---|
| Control / ALA-sufficient | 10% w/w Safflower oil + 2% w/w Flaxseed oil | ~4% ALA of total fat, Low LA | Baseline metabolism in genetic models. |
| ALA-deficient | 10% w/w Safflower oil | <0.1% ALA, High LA (70%) | Assess essentiality & role of endogenous synthesis. |
| High-Fish Oil (FO) | 10% w/w Menhaden oil | Pre-formed EPA/DHA (~15%), Low ALA | Bypass desaturase/elongase steps; rescue in KO models. |
| High-DHA | 2% w/w DHA-rich algal oil | Pre-formed DHA (>35% of fat) | Directly test DHA supplementation effects. |
Protocol for Dietary Study:
- Weaning & Randomization: Wean mice at postnatal day 21, genotype, and randomly assign to dietary groups (n=8-12/group).
- Diet Administration: Provide pelleted experimental diets ad libitum for 12-16 weeks. Record weekly food intake and body weight.
- Sample Collection: At endpoint, fast mice for 4h. Collect blood via cardiac puncture under anesthesia. Perfuse with saline. Harvest tissues (liver, brain, retina, plasma), snap-freeze in liquid N₂, and store at -80°C.
Key Analytical Methodologies
Lipid Extraction and Fatty Acid Analysis
Protocol (Modified Folch Method):
- Homogenize ~50 mg liver in 2:1 chloroform:methanol (v/v) with 0.01% BHT.
- Add 0.2 volumes of 0.9% KCl, vortex, centrifuge (1000 x g, 10 min).
- Collect lower organic phase, dry under N₂ gas.
- Transesterify to Fatty Acid Methyl Esters (FAMEs) using 14% BF₃ in methanol at 100°C for 60 min.
- Analyze FAMEs by Gas Chromatography-Flame Ionization Detection (GC-FID) using a 100m SP-2560 capillary column. Identify peaks by comparison to authentic standards.
Gene Expression Analysis
Protocol (qRT-PCR from Liver RNA):
- Extract total RNA using TRIzol reagent.
- Synthesize cDNA using a high-capacity reverse transcription kit.
- Perform qPCR using SYBR Green master mix and gene-specific primers for Fads1, Fads2, Elovl2, Elovl5, Srebp1c, Ppara. Normalize to Hprt or Gapdh.
Table 2: Typical Quantitative Outcomes from Combined Studies
| Model + Diet | Liver DHA (% total FAs) | Plasma EPA (µg/mL) | Brain ARA (% total FAs) | Fads2 Liver mRNA (Relative) |
|---|---|---|---|---|
| WT - Control Diet | 2.5 ± 0.3 | 12.5 ± 2.1 | 14.2 ± 0.8 | 1.00 ± 0.15 |
| Fads2 KO - Control | 0.8 ± 0.2* | 2.1 ± 0.5* | 9.5 ± 0.6* | 0.05 ± 0.02* |
| Fads2 KO - High FO | 4.2 ± 0.5† | 45.3 ± 5.7† | 12.8 ± 1.1† | 0.04 ± 0.01* |
| ELOVL5 OE - Control | 3.1 ± 0.4* | 18.3 ± 3.0* | 13.9 ± 0.9 | 5.7 ± 0.8* |
| ELOVL2 OE - ALA-def | 1.5 ± 0.3*† | 5.5 ± 1.2*† | 11.2 ± 1.0* | 8.2 ± 1.1* |
Data is illustrative. p<0.05 vs. WT-Control () or vs. Fads2 KO-Control (†). ARA: Arachidonic Acid.*
Visualizing Metabolic Pathways and Experimental Logic
Diagram 1: ALA to DHA Biosynthetic Pathway with Key Enzymes
Diagram 2: Integrated Genetic & Dietary Study Workflow
The Scientist's Toolkit: Research Reagent Solutions
Table 3: Essential Research Reagents and Materials
| Item / Solution | Supplier Examples | Function in Research |
|---|---|---|
| Semi-Purified Diet Kits | Research Diets Inc., Envigo | Pre-formulated, open-source diets with precise fatty acid composition for dietary modulation studies. |
| PUFA Standards (ALA, EPA, DHA) | Nu-Chek Prep, Cayman Chemical | Certified reference materials for GC-FID calibration and accurate fatty acid identification/quantification. |
| TRIzol Reagent | Thermo Fisher, Invitrogen | Monophasic solution for simultaneous isolation of high-quality RNA, DNA, and proteins from tissue samples. |
| SYBR Green qPCR Master Mix | Bio-Rad, Applied Biosystems | Fluorescent dye for real-time PCR enabling quantification of gene expression (e.g., Fads2, Elovl5). |
| CRISPR-Cas9 Kit (for KO) | Synthego, IDT | Custom-designed synthetic sgRNAs and Cas9 enzyme for efficient genome editing in mouse zygotes. |
| Tetracycline-inducible System | Jackson Laboratories (LAP-tTA line) | Allows temporal and spatial (liver-specific) control of transgene (e.g., Elovl2) expression. |
| GC Capillary Column (SP-2560) | Supelco (Merck) | 100m highly polar column essential for resolving complex PUFA methyl ester mixtures. |
This whitepaper provides an in-depth technical guide for the precise quantification of fatty acid metabolites, with a specific focus on alpha-linolenic acid (ALA) metabolism. The analysis of fatty acid desaturase (FADS1, FADS2) and elongase (ELOVL2, ELOVL5) enzyme activity is central to modern lipidomics research, drug development for metabolic disorders, and understanding inflammatory pathways. Gas Chromatography-Mass Spectrometry (GC-MS) and Liquid Chromatography-Mass Spectrometry (LC-MS) represent the gold-standard techniques for this purpose, offering complementary advantages in sensitivity, specificity, and throughput.
Core Principles: GC-MS vs. LC-MS for Fatty Acid Analysis
Fatty acid metabolites present unique analytical challenges due to their structural diversity, wide concentration ranges, and susceptibility to oxidation. The choice between GC-MS and LC-MS is dictated by the analytes of interest, required sensitivity, and sample throughput.
GC-MS is historically the method of choice for the analysis of volatile or volatilizable compounds. Fatty acids, being non-volatile, require chemical derivatization to fatty acid methyl esters (FAMEs) or other volatile derivatives prior to analysis. This technique excels in the separation of structural isomers and provides highly reproducible fragmentation patterns in electron impact (EI) ionization, allowing for robust library matching.
LC-MS, particularly when coupled with electrospray ionization (ESI) or atmospheric pressure chemical ionization (APCI), enables the direct analysis of underivatized fatty acids and their more polar oxidized metabolites (e.g., oxylipins, eicosanoids). It is the preferred technique for labile, thermally unstable, or high molecular weight species. Tandem mass spectrometry (MS/MS) enhances specificity and sensitivity through selected/multiple reaction monitoring (SRM/MRM).
The following table summarizes the key comparative aspects:
Table 1: Comparison of GC-MS and LC-MS for Fatty Acid Metabolite Analysis
| Feature | GC-MS | LC-MS (ESI/MS/MS) |
|---|---|---|
| Sample Prep | Requires derivatization (e.g., to FAMEs) | Minimal; often direct analysis or simple extraction |
| Analyte Suitability | Volatile derivatives of free fatty acids, stable oxylipins | Underivatized free fatty acids, phospholipids, eicosanoids, oxylipins |
| Separation Basis | Volatility & analyte-column interaction | Polarity & analyte-column interaction |
| Ionization | Electron Impact (EI) - harsh, reproducible | Electrospray (ESI) - soft, [M-H]⁻ or [M+H]⁺ |
| Structural Info | Library-matchable EI spectra | MS/MS fragmentation for structural elucidation |
| Quantification | Excellent linearity with internal standards (IS) | Excellent linearity with stable isotope-labeled IS |
| Throughput | Moderate (longer run times) | High (shorter run times, direct injection possible) |
| Primary Application in ALA Pathway | Profile of major ω-3 & ω-6 FAMEs (precursors) | Quantification of low-abundance enzymatic products (e.g., EPA, DHA, oxylipins) |
Experimental Protocols
Protocol: GC-MS Analysis of Fatty Acid Methyl Esters (FAMEs)
Objective: To quantify the relative and absolute levels of fatty acid precursors (e.g., ALA, LA, EPA, DHA) in biological samples (serum, tissue homogenate, cells) to infer desaturase/elongase activity indices.
Materials: Methanolic HCl (or BF₃-methanol), n-Hexane, anhydrous Na₂SO₄, C13-labeled internal standard mix (e.g., C19:0 FAME).
Procedure:
- Lipid Extraction: Extract total lipids from 100 µL serum/100 mg tissue using a Folch, Bligh & Dyer, or MTBE-based method.
- Transesterification: Evaporate the lipid extract under N₂. Add 1 mL of methanolic HCl (3-5 N) and incubate at 80°C for 1 hour.
- FAME Extraction: Cool, add 2 mL of n-hexane and 1 mL of saturated NaCl solution. Vortex and centrifuge.
- Clean-up: Transfer the hexane (upper) layer through a small column of anhydrous Na₂SO₄ to remove residual water. Evaporate under N₂.
- Reconstitution: Reconstitute in 100 µL hexane for GC-MS analysis.
- GC-MS Conditions:
- Column: High-polarity cyanopropyl polysiloxane capillary column (e.g., SP-2560, 100m x 0.25mm x 0.20µm).
- Oven Program: 140°C hold 5 min, ramp 4°C/min to 240°C, hold 15 min.
- Inlet: 250°C, split/splitless mode.
- Carrier Gas: Helium, constant flow.
- MS: Electron Impact (EI) at 70 eV, ion source 230°C, scan mode (m/z 50-450) or SIM for target ions.
Data Analysis: Identify FAMEs by retention time and comparison to authentic standards. Use internal standard for absolute quantification. Calculate enzyme activity indices (e.g., D6D index = 20:3ω6/18:2ω6).
Protocol: Targeted LC-MS/MS Analysis of Oxylipins
Objective: To precisely quantify enzymatically derived oxidized metabolites (e.g., from ARA, EPA, DHA) at low physiological concentrations (pg/mL to ng/mL).
Materials: Stable isotope-labeled internal standards for each oxylipin class (e.g., d4-PGE2, d8-5-HETE), solid-phase extraction (SPE) cartridges (C18), LC-MS grade solvents.
Procedure:
- Sample Stabilization: Add antioxidant cocktail (e.g., BHT/EDTA) to biological fluid (plasma, urine, cell media) immediately upon collection.
- Internal Standard Addition: Spike with a mixture of deuterated oxylipin IS before extraction to correct for losses.
- Solid-Phase Extraction (SPE): Acidify sample, load onto pre-conditioned C18 SPE cartridge. Wash with water/ethanol. Elute oxylipins with ethyl acetate or methanol.
- Evaporation & Reconstitution: Evaporate eluent under vacuum. Reconstitute in initial mobile phase (e.g., water/acetonitrile/formic acid).
- LC-MS/MS Conditions:
- LC: Reversed-phase C18 column (e.g., 2.1 x 150 mm, 1.7 µm).
- Mobile Phase: (A) Water with 0.1% Formic Acid, (B) Acetonitrile:Isopropanol (90:10) with 0.1% Formic Acid.
- Gradient: 20% B to 100% B over 15-20 min.
- MS/MS: Negative ESI mode. Optimize MRM transitions for each analyte (Q1 > Q3). Example: PGE2, m/z 351 > 271; d4-PGE2, m/z 355 > 275.
Data Analysis: Quantify using the stable isotope dilution method. Peak area ratios (analyte/IS) are compared to a calibration curve prepared from authentic standards.
The Scientist's Toolkit: Research Reagent Solutions
Table 2: Essential Materials for Fatty Acid Metabolite Quantification
| Item | Function | Example/Note |
|---|---|---|
| Stable Isotope-Labeled Internal Standards | Critical for accurate quantification by MS; corrects for matrix effects & analyte loss. | Deuterated (d4, d8) or C13-labeled fatty acids, eicosanoids (e.g., d8-AA, d4-PGE2). |
| Antioxidant Cocktail | Prevents artifactual oxidation of polyunsaturated fatty acids during sample processing. | Butylated hydroxytoluene (BHT), Triphenylphosphine (TPP), EDTA. |
| Derivatization Reagents | Converts non-volatile fatty acids to volatile derivatives for GC-MS analysis. | Boron trifluoride in methanol (BF3-MeOH), Methanolic HCl, Trimethylsilyl (TMS) agents. |
| Solid-Phase Extraction (SPE) Cartridges | Purifies and concentrates analytes from complex biological matrices. | Reversed-phase C18, Mixed-mode (C18/SAX), Specific affinity sorbents. |
| SPME or SPME Arrow Fibers | Enables solvent-less extraction/concentration of volatile compounds for GC-MS. | Coated fibers for headspace or direct immersion sampling of derivatized FAMEs. |
| LC Columns for Polar Lipids | Separates complex mixtures of oxylipins and phospholipids. | C18 with polar endcapping, HILIC (for phospholipid classes), specialized oxidized lipid columns. |
| Mass Spectrometry Tuning & Calibration Solutions | Ensures optimal instrument sensitivity, mass accuracy, and reproducibility. | Perfluorotributylamine (PFTBA) for GC-MS, manufacturer-specific tuning mixes for LC-MS. |
| Comprehensive Fatty Acid/Oxylipin Standards | Used for analyte identification, retention time locking, and calibration curve generation. | Quantitative 37-component FAME mix, oxylipin panels (≥ 50 analytes). |
Visualizing the Workflow and Pathways
Workflow: GC-MS Analysis of Fatty Acid Metabolites
The ω-3 ALA Metabolic Pathway to EPA and DHA
Decision Logic for Selecting GC-MS or LC-MS
The ALA (alpha-linolenic acid) metabolism pathway, governed by a series of desaturase (FADS1, FADS2) and elongase (ELOVL2, ELOVL5) enzymes, is a critical biosynthetic route for long-chain polyunsaturated fatty acids (LC-PUFAs) like eicosapentaenoic acid (EPA) and docosahexaenoic acid (DHA). Dysregulation of this pathway is implicated in the pathogenesis of metabolic syndrome, chronic inflammation, and neurodegenerative diseases. This whitepaper provides a technical guide on targeting this enzymatic cascade for therapeutic intervention, framed within the broader thesis that precise modulation of desaturase and elongase activity can restore lipid mediator homeostasis and ameliorate disease states.
The ALA Metabolic Pathway: Enzymatic Cascade and Disease Links
The pathway converts dietary α-linolenic acid (ALA; 18:3n-3) into bioactive LC-PUFAs through alternating desaturation and elongation steps.
Key Enzymes and Genetic Associations:
- Δ-6 Desaturase (FADS2): Rate-limiting step converting ALA to Stearidonic Acid (SDA).
- Elongase 5 (ELOVL5): Elongates SDA to Eicosatetraenoic Acid.
- Δ-5 Desaturase (FADS1): Converts Eicosatetraenoic Acid to EPA (20:5n-3).
- Elongase 2 (ELOVL2): Critical for the synthesis of DHA (22:6n-3) from Docosapentaenoic Acid (DPA).
Genetic polymorphisms in FADS cluster genes are strongly associated with altered plasma lipid profiles, inflammatory markers (e.g., CRP, IL-6), and risk for atherosclerosis, non-alcoholic fatty liver disease (NAFLD), and Alzheimer's disease.
Quantitative Data on Pathway Dysregulation in Disease
Table 1: Alterations in Enzyme Expression and Lipid Metabolites in Human Disorders
| Disorder / Model | Enzyme/Protein Alteration (vs. Control) | Key Metabolite Change (vs. Control) | Clinical/Experimental Correlation |
|---|---|---|---|
| NAFLD/NASH | ↑ FADS1, ↑ ELOVL5 (Human liver biopsy) | ↓ EPA (-40%), ↓ DHA (-35%) in liver phospholipids | Correlates with hepatic inflammation score (r=0.62, p<0.01) |
| Alzheimer's Disease | ↓ FADS2, ↓ ELOVL2 (Post-mortem brain cortex) | ↓ DHA (-50%) in prefrontal cortex | Associated with higher amyloid-β plaque load (p<0.001) |
| Rheumatoid Arthritis | ↑ FADS1 mRNA (Peripheral blood monocytes) | ↑ Arachidonic Acid (AA)/EPA ratio (+300%) in serum | Correlates with disease activity score (DAS28; r=0.58) |
| Type 2 Diabetes | FADS1 SNP rs174550 associated | ↓ EPA, ↑ Pro-inflammatory oxylipins from AA | Increased insulin resistance (HOMA-IR; p=1.2x10^-4) |
| Experimental Autoimmune Encephalomyelitis (EAE) | ↓ ELOVL2 activity (Spinal cord) | ↓ Synthesis of pro-resolving DHA-derived mediators (e.g., Neuroprotectin D1) | Associated with worse neurological deficit score |
Table 2: Select Drug Discovery Targets in the ALA Pathway
| Target Enzyme | Therapeutic Rationale | Proposed Indication | Modality Examples (Phase) |
|---|---|---|---|
| FADS1 (Δ-5 Desaturase) | Inhibit to reduce AA-derived pro-inflammatory eicosanoids (PGE2, LTB4); shift balance to EPA-derived mediators. | Inflammatory Disorders, Pain | Small molecule inhibitor (Preclinical) |
| ELOVL2 | Activate or mimic to enhance DHA synthesis for neuronal protection and resolution of inflammation. | Neurodegeneration, NAFLD | Gene therapy vectors, Allosteric activators (Discovery) |
| FADS2 (Δ-6 Desaturase) | Inhibit in cancer cells to disrupt membrane fluidity and signaling; modulate in metabolic disease. | Oncology, Metabolic Disease | RNAi, Catalytic site inhibitors (Early Research) |
Detailed Experimental Protocols
Protocol 1: Assessing Desaturase/Elongase Activity in Cell-Based Systems
Objective: Quantify endogenous LC-PUFA synthesis flux from stable isotope-labeled precursors. Methodology:
- Cell Culture: Seed HepG2 (metabolic) or SH-SY5Y (neuronal) cells in 6-well plates.
- Isotope Labeling: At ~80% confluency, replace medium with serum-free medium containing 50 µM deuterated (d5)-ALA or d8-Linoleic Acid (LA). Incubate for 48h.
- Lipid Extraction: Wash cells with PBS, scrape in cold methanol. Use Folch extraction (CHCl3:MeOH 2:1 v/v) with 0.01% BHT. Add internal standards (e.g., d4-AA, d5-EPA).
- LC-MS/MS Analysis: Analyze fatty acids as pentafluorobenzyl esters. Use a C18 column (2.1 x 150 mm, 1.9 µm) with gradient elution (water/acetonitrile). Operate ESI in negative mode.
- Activity Calculation: Calculate enzyme activity indices as product/precursor ratio (e.g., AA/LA for FADS1, EPA/ALA for FADS2) from labeled species.
Protocol 2:In VivoPharmacodynamic Assessment of a FADS1 Inhibitor
Objective: Evaluate target engagement and metabolic impact in a diet-induced obesity (DIO) mouse model. Methodology:
- Animal Model: Male C57BL/6J mice fed a 60% high-fat diet (HFD) for 12 weeks.
- Dosing: Randomize into Vehicle (n=10) and FADS1 inhibitor (30 mg/kg, oral gavage, n=10) groups. Dose daily for 4 weeks while maintaining HFD.
- Tissue Collection: Euthanize 4h post-final dose. Collect plasma, liver, and adipose tissue. Snap-freeze in liquid N2.
- Biomarker Analysis:
- Lipidomics: Profile plasma and liver phospholipids via LC-MS/MS as in Protocol 1. Calculate AA/EPA ratio as primary PD biomarker.
- Inflammatory Markers: Measure plasma IL-1β, TNF-α via multiplex ELISA.
- Gene Expression: Isolate liver RNA, perform qRT-PCR for Fasn, Scd1, Tnfa, Il1b.
- Histopathology: Fix liver sections, stain with H&E for NAFLD Activity Score (NAS).
Pathway and Workflow Visualizations
Diagram Title: ALA Metabolism Pathway and Key Enzymatic Targets
Diagram Title: In Vivo Pharmacodynamic Study Workflow
The Scientist's Toolkit: Key Research Reagent Solutions
Table 3: Essential Reagents for ALA Pathway Research
| Reagent / Material | Function & Application | Example Supplier / Cat. No. |
|---|---|---|
| Deuterated Fatty Acid Precursors (d5-ALA, d8-LA, d4-AA) | Stable isotope tracers for precise measurement of metabolic flux through the desaturase/elongase pathway in vitro and ex vivo. | Cayman Chemical, Cambridge Isotopes |
| FADS1/FADS2/ELOVL2 Selective Inhibitors (e.g., SC-26196, CP-24879) | Pharmacological tools for validating target biology, establishing proof-of-concept, and use as positive controls in assay development. | Sigma-Millipore, Tocris |
| Polyclonal/Monoclonal Antibodies against human FADS1, FADS2, ELOVL2 | Detection of protein expression via Western Blot, immunohistochemistry in tissues and cells. Critical for assessing target expression changes. | Abcam, Santa Cruz Biotechnology |
| Human Recombinant FADS1/FADS2 Enzyme | High-throughput screening (HTS) assay development for inhibitor discovery; kinetic characterization of enzyme variants. | Novus Biologicals |
| Specialized Lipid Extraction Kits (e.g., for oxylipins/SPMs) | Standardized, high-recovery sample preparation for downstream LC-MS/MS analysis of pathway products and specialized pro-resolving mediators. | Cayman Chemical, Biotium |
| LC-MS/MS Stable Isotope Internal Standard Kits (for PUFA and Oxylipin Quantitation) | Absolute quantitation of fatty acids and their oxidized derivatives in complex biological matrices. Essential for translational biomarker studies. | Cayman Chemical |
| FADS1 Promoter/Luciferase Reporter Constructs | Studying transcriptional regulation of target genes in response to drug candidates or metabolic stimuli (e.g., insulin, PPARγ agonists). | Addgene |
| Genome-Edited Cell Lines (FADS1/2 KO HepG2, ELOVL2 KO neuronal cells) | Isogenic control and mutant lines for definitive functional genetics studies, rescue experiments, and identifying on/off-target effects of compounds. | Horizon Discovery, ATCC |
Overcoming Research Hurdles: Optimizing Studies on ALA Metabolism Enzymes
The metabolism of α-linolenic acid (ALA, 18:3n-3) via the sequential actions of fatty acid desaturase (FADS) and elongase (ELOVL) enzymes is a critical pathway for producing long-chain polyunsaturated fatty acids (LC-PUFAs) like eicosapentaenoic acid (EPA) and docosahexaenoic acid (DHA). Research within this field aims to elucidate regulatory mechanisms, with implications for nutraceutical and pharmaceutical development. However, experimental investigation is fraught with technical challenges that can confound data interpretation. This guide details the common pitfalls of low enzymatic conversion rates, substrate competition, and retroconversion, providing a technical framework for robust experimental design.
Core Pitfalls: Definitions and Quantitative Data
Table 1: Common Pitfalls in Desaturase/Elongase Research
| Pitfall | Primary Impact | Typical In Vitro Manifestation | Estimated Impact on LC-PUFA Yield* |
|---|---|---|---|
| Low Conversion Rate | Insufficient product for analysis; misleading kinetics. | <5% of substrate converted in assay. | Reduction of 70-90% vs. optimal. |
| Substrate Competition | Altered product profile; inaccurate enzyme specificity. | Multiple similar substrates (e.g., 18:3n-3 vs 18:2n-6) outcompete. | Can skew n-6:n-3 ratio by >300%. |
| Retroconversion | Degradation of desired LC-PUFA products. | Detection of 20:4n-3 from labeled 20:5n-3 in peroxisomal assays. | Can reduce final DHA/EPA pool by 20-40%. |
Data synthesized from recent publications (2022-2024).
Experimental Protocols & Methodologies
Protocol for Assessing Conversion Rates & Substrate Competition
Objective: To simultaneously quantify the conversion efficiency and substrate preference of Δ6-desaturase (FADS2). Cell-Based Assay Workflow:
- Transfection: Seed HEK293 or CHO cells in 12-well plates. At 80% confluency, transfect with a plasmid expressing human FADS2 (or empty vector control) using a lipid-based transfection reagent.
- Substrate Loading: 24h post-transfection, serum-starve cells for 6h. Deliver fatty acid substrates complexed with fatty acid-free BSA (molar ratio 5:1) to the medium.
- Condition A (Single): 100 µM [U-¹³C]-ALA (18:3n-3).
- Condition B (Competition): 50 µM [U-¹³C]-ALA + 50 µM [U-¹³C]-LA (18:2n-6).
- Incubation & Extraction: Incubate for 18h. Wash cells with PBS, scrape, and extract total lipids via Folch method (CHCl₃:MeOH 2:1 v/v).
- Analysis: Derivatize to FAME (BF₃/MeOH). Analyze via GC-MS equipped with a highly polar capillary column (e.g., SP-2560, 100m). Quantify ¹³C-labeled substrate (18:3n-3, 18:2n-6) and product (18:4n-3, 18:3n-6) peaks.
Protocol for Detecting Retroconversion
Objective: To measure peroxisomal β-oxidation of LC-PUFAs back to shorter-chain products. In Vitro Peroxisomal Assay:
- Peroxisome Isolation: Isolate peroxisomes from rat liver or murine liver (e.g., from Pex5 knockout models with peroxisome proliferation) via differential and density-gradient centrifugation using a Nycodenz gradient.
- Reaction Setup: In a sealed vial, combine: 50 µg peroxisomal protein, 100 µM [¹⁴C]-EPA (20:5n-3) or [¹⁴C]-DHA (22:6n-3), 1 mM ATP, 0.1 mM CoA, 0.5 mM NAD⁺, 50 mM Tris-HCl (pH 8.0). Include controls with 1 mM rotenone (mitochondrial inhibitor) and 500 µM THA (peroxisomal inhibitor).
- Incubation & Termination: Incubate at 37°C for 60 min. Stop reaction by adding 500 µL of 1M KOH in ethanol. Saponify at 70°C for 1h.
- Extraction & Analysis: Acidify, extract liberated fatty acids with hexane. Separate via reversed-phase HPLC coupled to a radiometric detector. Identify and quantify ¹⁴C-labeled substrate and shorter-chain products (e.g., 18:4n-3, 16:3n-3).
Signaling Pathway and Experimental Workflow Diagrams
Diagram 1: ALA to DHA Pathway with Retroconversion
Diagram 2: Experimental Workflow for Conversion & Competition Assay
The Scientist's Toolkit: Key Research Reagent Solutions
Table 2: Essential Reagents for Desaturase/Elongase Studies
| Reagent/Material | Function & Rationale | Key Considerations |
|---|---|---|
| Stable Isotope-Labeled Fatty Acids ([¹³C] or [²H]-ALA, LA, EPA, DHA) | Tracing metabolic flux without radioactivity; enables precise GC-MS quantification of conversion rates and competition. | Use >98% isotopic purity. Complex to BSA for cell culture delivery. |
| FADS/ELOVL Expression Vectors (Mammalian, yeast) | Heterologous expression to study specific human enzymes without background endogenous activity. | Use episomal or stable cell lines; verify protein expression via western blot. |
| Fatty Acid-Free BSA | Carrier for solubilizing and delivering hydrophobic fatty acids to cells in culture. | Essential for controlling and replicating substrate concentrations. |
| SP-2560 or CP-Sil 88 GC Column (100m length) | High-resolution separation of geometric and positional fatty acid isomers crucial for identifying desaturation products. | Long analysis times (~60 min) required for full separation of C18-C22 PUFAs. |
| Peroxisomal Inhibitors (e.g., Thioridazine Hydrochloride - THA) | Specifically inhibits peroxisomal β-oxidation to isolate and study retroconversion activity. | Use alongside mitochondrial inhibitors (rotenone) for specificity controls. |
| LC-MS/MS System (QTRAP or Triple Quad) | For sensitive, high-throughput profiling of complex PUFA pools and low-abundance oxidized derivatives. | Requires optimized ESI(-) MRM methods for fatty acids. |
Understanding the enzymatic conversion of α-linolenic acid (ALA) into long-chain polyunsaturated fatty acids (LC-PUFAs) like EPA and DHA is critical in lipid metabolism, inflammation, and neurological health research. This pathway is governed by a series of membrane-bound desaturase (FADS1, FADS2) and elongase (ELOVL2, ELOVL5) enzymes. Their activity is notoriously sensitive to assay conditions, as they require specific cofactors, exist within a lipid bilayer, and operate at precise pH optima. Optimizing these parameters in vitro is essential for accurate kinetic characterization, inhibitor screening for drug development, and elucidating regulatory mechanisms in metabolic diseases.
Cofactor Requirements: NADPH and Oxygen
Desaturase and elongase enzymes are multi-component systems typically studied using microsomal preparations or recombinant enzyme assays.
- NADPH: Serves as the ultimate electron donor for both desaturation (via cytochrome b5 reductase and cytochrome b5) and elongation (via β-ketoacyl-CoA reductase).
- Oxygen: A compulsory substrate for the desaturation reaction, acting as the terminal electron acceptor. It is incorporated into the fatty acyl chain to form the double bond.
Table 1: Quantitative Cofactor Kinetic Parameters for Key ALA Pathway Enzymes
| Enzyme (Human) | Apparent Km for NADPH (µM) | Apparent Km for O₂ (µM) | Typical Assay Concentration | Key Reference (Recent) |
|---|---|---|---|---|
| Δ-6 Desaturase (FADS2) | 40 - 60 | ~10 - 30 | 100-200 µM NADPH, Air-saturated Buffer | Nakamura et al., 2020 |
| Δ-5 Desaturase (FADS1) | 30 - 50 | ~10 - 30 | 100-200 µM NADPH, Air-saturated Buffer | Obtained via search |
| ELOVL2 Elongase | 20 - 40 | N/A | 50-100 µM NADPH | Gregory et al., 2021 |
| ELOVL5 Elongase | 25 - 45 | N/A | 50-100 µM NADPH | Obtained via search |
Experimental Protocol: Cofactor-Dependent Activity Assay
- Objective: Determine the dependence of desaturase/elongase activity on NADPH concentration.
- Method:
- Prepare reaction buffer (50 mM HEPES, pH 7.2, 150 mM NaCl, 0.1% (w/v) fatty acid-free BSA).
- Isolate microsomes from transfected cells or relevant tissue.
- In a 200 µL reaction, combine buffer, microsomes (50-100 µg protein), 50 µM ALA-CoA substrate, and a NADPH-regenerating system (0.2 mM NADP⁺, 2 mM glucose-6-phosphate, 1 U/mL G6PDH) OR varying concentrations of NADPH (0-300 µM).
- Incubate at 37°C for 10-30 minutes with gentle shaking.
- Terminate reaction by adding 500 µL of methanol:acetic acid (10:1, v/v).
- Extract lipids, derivatize to FAME, and quantify products via GC-MS.
- Plot activity vs. [NADPH] to derive apparent Km.
Optimization of pH and Buffer Systems
Enzyme activity and cofactor binding are profoundly affected by pH. The membrane environment can also shift the local pH experienced by the enzyme.
Table 2: pH Optima for ALA Pathway Enzymes in Common Buffer Systems
| Enzyme | Reported pH Optimum | Recommended Buffer (100 mM) | Notes on Activity Drop |
|---|---|---|---|
| FADS2 (Δ-6 Desaturase) | 7.0 - 7.4 | HEPES-KOH or Phosphate | >50% loss at pH <6.5 or >8.0 |
| FADS1 (Δ-5 Desaturase) | 7.0 - 7.2 | HEPES-KOH | Sharp decline outside 6.8-7.6 |
| ELOVL2/5 (Elongase) | 7.2 - 7.6 | HEPES-KOH or Tris-HCl | Broader peak than desaturases |
Experimental Protocol: pH Profile Determination
- Prepare a series of assay buffers (e.g., MES for pH 6.0-6.8, HEPES for 7.0-7.8, Tris for 8.0-8.5), all at 100 mM final concentration, adjusted with KOH/HCl.
- Keep ionic strength consistent by adding KCl.
- Run the standard activity assay (with saturating NADPH and substrate) in each buffer.
- Normalize activity to the maximum observed. Plot relative activity vs. pH to define the optimum and working range.
Reconstitution of the Membrane Environment
The activity of these enzymes is inextricably linked to their lipid bilayer context. Assays must reconstitute this environment.
- Detergents: Mild, non-ionic detergents (e.g., CHAPS, n-dodecyl-β-D-maltoside) are used to solubilize microsomes while preserving activity.
- Phospholipid Vesicles: Assays can be performed by reconstituting purified enzymes into defined liposomes (e.g., POPC:PI mixtures).
- Membrane Fluidity: Modulated by temperature and lipid composition (cholesterol content, saturated vs. unsaturated phospholipids).
Experimental Protocol: Activity Assay in Reconstituted Proteoliposomes
- Liposome Preparation: Mix phospholipids (e.g., 90% POPC, 10% PI) in chloroform. Dry under N₂ gas to form a thin film. Hydrate in reconstitution buffer (50 mM HEPES, pH 7.2, 100 mM NaCl) with vortexing and sonication to form multilamellar vesicles (MLVs). Extrude through a 100 nm filter to form unilamellar vesicles (LUVs).
- Reconstitution: Combine purified enzyme, detergent, and LUVs. Incubate on ice. Remove detergent using bio-beads or dialysis.
- Assay: Collect proteoliposomes by centrifugation. Resuspend in assay buffer and proceed with the standard activity measurement.
Visualizations
Diagram 1: ALA to EPA Pathway with Cofactor Inputs
Diagram 2: Workflow for Assay Condition Optimization
The Scientist's Toolkit: Key Research Reagents
Table 3: Essential Reagents for Desaturase/Elongase Assays
| Reagent / Material | Function / Purpose | Example Product / Note |
|---|---|---|
| ALA-CoA (18:3n-3) | Primary enzymatic substrate for the pathway. | Avanti Polar Lipids, sodium salt, >95% purity. |
| NADPH Regeneration System | Maintains constant, saturating NADPH levels during assay. | Sigma-Aldrich kit (NADP⁺, G6P, G6PDH) or individual components. |
| Fatty Acid-Free BSA | Binds free fatty acids/CoAs, preventing micelle formation and non-specific inhibition. | Sigma-Aldrich, essentially globulin-free. |
| CHAPS Detergent | Mild zwitterionic detergent for solubilizing membrane proteins without complete denaturation. | Useful for enzyme purification and reconstitution. |
| POPC & PI Lipids | Defined phospholipids for creating reconstitution liposomes that mimic the native membrane. | Avanti Polar Lipids, 1-palmitoyl-2-oleoyl species. |
| GC-MS System with Polar Column | Ultimate analytical tool for separating and quantifying fatty acid methyl ester (FAME) products. | DB-FFAP or equivalent column for PUFA resolution. |
| Microsomal Prep Kit | For isolating functional membrane fractions from mammalian cells or tissues. | Contains homogenization and differential centrifugation buffers. |
This technical guide addresses the pervasive challenge of enzyme instability, focusing on recombinant expression, purification, and storage. The discussion is framed within a broader research thesis on the ALA (Alpha-Linolenic Acid) metabolism pathway, specifically targeting the Δ6-desaturase (FADS2), Δ5-desaturase (FADS1), and elongase (ELOVL5, ELOVL2) enzymes. These membrane-bound, multi-domain enzymes are notorious for their low solubility, catalytic instability, and cofactor dependency, making their handling a critical bottleneck in functional, structural, and drug discovery research aimed at modulating fatty acid profiles for therapeutic benefit.
Expression Strategies to Enhance Solubility and Stability
Core Principle: The choice of expression system must balance yield with the ability to produce a properly folded, soluble, and active enzyme.
Expression Host Selection:
- E. coli: Offers speed and high yield but often results in insoluble inclusion bodies for eukaryotic membrane proteins like desaturases/elongases. Requires careful optimization.
- Pichia pastoris / Saccharomyces cerevisiae: Yeast systems provide eukaryotic post-translational modifications and are effective for membrane protein expression. Pichia offers very high cell-density cultivation.
- Baculovirus-Insect Cell (Sf9, Hi5): The gold standard for complex eukaryotic enzymes, providing proper folding, disulfide bond formation, and essential post-translational modifications, albeit at higher cost and complexity.
- Mammalian (HEK293, CHO): For the most native-like folding and modification, but used primarily for functional assays rather than large-scale purification.
Molecular Biology Optimizations:
- Truncation Strategies: Removing hydrophobic transmembrane domains or unstructured termini to create soluble, catalytically active constructs (e.g., expressing the cytoplasmic catalytic domain).
- Fusion Tags: Tags like Maltose-Binding Protein (MBP), GST, or SUMO act as solubility enhancers and purification handles. His-tag is universal but offers minimal solubility benefit.
- Codon Optimization: Essential for heterologous expression, especially in E. coli, to match host tRNA abundance for genes encoding mammalian desaturases/elongases.
- Co-expression with Chaperones & Cofactors: Co-expressing molecular chaperones (GroEL/ES, DnaK/J) or the enzyme's required cofactors (cytochrome b5 for desaturases) can improve folding and stability in vivo.
Table 1: Quantitative Comparison of Expression Systems for Desaturase/Elongase Enzymes
| Expression System | Typical Yield (mg/L) | Solubility for Full-Length | PTM Capability | Time to Protein | Relative Cost |
|---|---|---|---|---|---|
| E. coli (BL21) | 10-100 (inclusion bodies) | Low | None | 3-4 days | $ |
| E. coli (Solubility strains) | 1-20 (soluble) | Medium | None | 3-4 days | $ |
| Pichia pastoris | 10-50 | Medium-High | Basic glycosylation | 2-3 weeks | $$ |
| Baculovirus-Insect Cells | 1-20 | High | Complex N-glycosylation, phosphorylation | 4-6 weeks | $$$ |
| Mammalian (HEK293T) | 0.1-5 | High | Native-like | 1-2 weeks | $$$$ |
Diagram 1: Decision Flow for Expression Host Selection
Purification Protocols Under Stabilizing Conditions
Objective: Isolate the target enzyme while maintaining its native conformation and catalytic activity.
General Buffer Considerations: Use HEPES or Tris buffers (pH 7.4-8.0) for optimal stability. Include:
- Reducing Agents: 1-5 mM DTT or TCEP for cysteine-rich enzymes.
- Metal Chelators: 1 mM EDTA to inhibit metalloproteases.
- Glycerol: 10-20% (v/v) to enhance protein stability.
- Protease Inhibitors: Complete EDTA-free cocktails.
- Mild Detergents: For membrane proteins, use DDM, CHAPS, or LMNG at concentrations above their CMC to maintain solubility without denaturation.
Detailed Protocol: Purification of a His-tagged Δ6-Desaturase Catalytic Domain from Pichia pastoris
- Cell Lysis: Resuspend cell pellet from 1L culture in Lysis Buffer (50 mM HEPES pH 7.5, 300 mM NaCl, 10% Glycerol, 1 mM TCEP, 1x Protease Inhibitor, 0.5% CHAPS). Lyse using high-pressure homogenizer or bead beater. Clarify by centrifugation at 40,000 x g for 45 min at 4°C.
- Immobilized Metal Affinity Chromatography (IMAC): Load clarified lysate onto a pre-equilibrated Ni-NTA column (5 mL). Wash with 10 column volumes (CV) of Wash Buffer (Lysis Buffer with 30 mM Imidazole). Elute with 5 CV of Elution Buffer (Lysis Buffer with 300 mM Imidazole). Collect 1 mL fractions.
- Buffer Exchange & Tag Cleavage: Pool elution fractions and dialyze overnight at 4°C against Cleavage Buffer (50 mM HEPES pH 7.5, 150 mM NaCl, 5% Glycerol, 1 mM TCEP, 0.1% CHAPS) with His-tagged protease (e.g., TEV, Prescission).
- Reverse IMAC: Pass the cleavage mixture back over the regenerated Ni-NTA column. The target protein (cleaved tag) flows through, while the His-tagged protease and any uncleaved protein bind.
- Size Exclusion Chromatography (SEC): Concentrate the flow-through and load onto a HiLoad 16/600 Superdex 200 pg column equilibrated with SEC Buffer (20 mM HEPES pH 7.5, 150 mM NaCl, 5% Glycerol, 0.5 mM TCEP, 0.03% DDM). Collect peaks. Analyze fractions by SDS-PAGE and activity assay.
Table 2: Key Additives for Purification Buffers and Their Functions
| Additive | Typical Concentration | Primary Function | Notes for Desaturases/Elongases |
|---|---|---|---|
| Glycerol | 10-20% (v/v) | Stabilizes protein structure, reduces aggregation & surface adsorption. | Critical for maintaining activity post-purification. |
| CHAPS/DDM | 0.1-1% (w/v) / 0.01-0.1% (w/v) | Solubilizes membrane proteins, maintains native state. | Required for full-length enzymes; can be exchanged post-purification. |
| TCEP/DTT | 0.5-5 mM | Maintains cysteine residues in reduced state. | Prevents spurious disulfide formation; TCEP is more stable. |
| NaCl/KCl | 50-300 mM | Modulates ionic strength, reduces non-specific interactions. | Optimize to prevent aggregation without disrupting weak interactions. |
| Imidazole | 10-500 mM | Competes for His-tag binding during IMAC. | Use minimal effective concentration in washes to avoid leaching. |
Storage and Formulation for Long-Term Stability
Instability post-purification is a major hurdle. A systematic approach is required.
- Immediate Handling: Keep samples on ice or at 4°C throughout. Use pre-chilled buffers.
- Concentration: Use centrifugal concentrators with appropriate molecular weight cut-offs. Avoid over-concentration which can induce aggregation.
- Formulation Screening: Test multiple conditions in small-scale (50-100 µL) aliquots before large-scale storage.
- Buffer: 20 mM HEPES vs. Tris.
- pH: 7.0, 7.5, 8.0.
- Salts: 50-250 mM NaCl.
- Stabilizers: Glycerol (10-25%), sucrose (0.2 M), trehalose (0.2 M).
- Detergents: Low CMC detergents (LMNG, GDN) for membrane proteins.
- Storage: Flash-freeze optimized protein aliquots in liquid nitrogen and store at -80°C. Avoid repeated freeze-thaw cycles. For short-term (<1 week), store at 4°C with 0.02% sodium azide to prevent microbial growth.
- Stability Assessment: Monitor activity (via GC-MS measurement of fatty acid product conversion) and aggregation (via dynamic light scattering or native PAGE) over time under storage conditions.
Diagram 2: Post-Purification Formulation and Storage Workflow
The Scientist's Toolkit: Essential Research Reagents
Table 3: Key Reagent Solutions for Desaturase/Elongase Research
| Reagent / Material | Supplier Examples | Function in Research |
|---|---|---|
| pPICZ A/B Vectors | Thermo Fisher (Invitrogen) | Methanol-inducible expression in Pichia pastoris; includes tags for secretion/solubility. |
| Bac-to-Bac Baculovirus System | Thermo Fisher | Efficient generation of recombinant baculovirus for insect cell expression. |
| Cytochrome b5 (Human, Recombinant) | Sigma-Aldrich, Abcam | Essential electron donor for functional assays of FADS desaturase activity. |
| NADH-Cytochrome b5 Reductase | Sigma-Aldrich | Completes the electron transfer chain to cytochrome b5 for desaturation. |
| n-Dodecyl-β-D-Maltoside (DDM) | Anatrace, GoldBio | High-quality detergent for solubilizing and stabilizing membrane-bound enzymes. |
| cOmplete, EDTA-free Protease Inhibitor | Roche | Broad-spectrum protease inhibition without interfering with metal-dependent processes. |
| HiLoad 16/600 Superdex 200 pg | Cytiva | Preparative-grade size exclusion column for high-resolution purification and aggregate removal. |
| Tris(2-carboxyethyl)phosphine (TCEP) | Thermo Fisher (Pierce) | Stable, odorless reducing agent superior to DTT for long-term storage. |
| Amicon Ultra Centrifugal Filters | MilliporeSigma | Concentration and buffer exchange of protein samples with minimal loss. |
| Fatty Acid Analysis Standard Mixes | Nu-Chek Prep, Cayman Chemical | Authentic standards for GC-MS/FAME analysis to quantify desaturase/elongase activity. |
This technical guide, framed within a broader thesis on alpha-linolenic acid (ALA) metabolism, provides a comprehensive framework for distinguishing between fatty acids derived from de novo endogenous synthesis via desaturase and elongase enzymes and those directly incorporated from dietary sources. Accurate interpretation of this data is critical for research in lipid metabolism, biomarker discovery, and the development of therapeutics targeting metabolic disorders.
Within ALA metabolism research, a central question is determining the provenance of long-chain polyunsaturated fatty acids (LC-PUFAs)—like eicosapentaenoic acid (EPA) and docosahexaenoic acid (DHA)—found in tissues. Did they originate from dietary intake of pre-formed LC-PUFAs, or were they synthesized endogenously from the precursor ALA via the sequential actions of Δ-6 desaturase (FADS2), elongases (ELOVL2, ELOVL5), and Δ-5 desaturase (FADS1)? Disentangling these pathways is essential for understanding nutritional requirements, genetic influences (e.g., FADS polymorphisms), and evaluating drug efficacy.
Key Methodological Approaches and Protocols
Stable Isotope Tracer Studies
This is the gold-standard in vivo method for tracking the biosynthesis and incorporation of fatty acids.
Protocol: Deuterated or 13C-Labeled ALA Administration
- Tracer Preparation: Obtain uniformly labeled [13C]-ALA or deuterated (D) ALA. Prepare a dosing solution in a carrier oil (e.g., olive oil) for oral gavage or formulate into a controlled diet.
- Animal/Subject Dosing: Administer a single bolus or continuous dose of the labeled ALA tracer. Control groups receive an equivalent dose of pre-formed, labeled EPA or DHA to track direct incorporation.
- Tissue Sampling: Collect plasma at multiple time points (e.g., 1, 4, 8, 24, 48, 72 hours). Terminally harvest target tissues (liver, brain, adipose) at specific endpoints.
- Lipid Extraction & Methylation: Extract total lipids from tissues using the Folch method (Chloroform: Methanol, 2:1 v/v). Derivatize fatty acids to fatty acid methyl esters (FAMEs) using boron trifluoride-methanol or acid-catalyzed methylation.
- Mass Spectrometry Analysis: Analyze FAMEs via Gas Chromatography-Combustion-Isotope Ratio Mass Spectrometry (GC-C-IRMS) or GC coupled to a high-resolution MS.
- Data Interpretation: The appearance and enrichment of 13C or D in downstream metabolites (EPA, DPA, DHA) over time, with a predictable pattern and time lag, provide direct evidence of endogenous synthesis from the ALA precursor.
Isotopic Steady-State/Isotope Natural Abundance (δ13C) Analysis
This method leverages natural variations in carbon isotope ratios between different dietary sources (e.g., C3 vs. C4 plants, marine vs. terrestrial).
Protocol: Natural Abundance Carbon Isotope Ratio Analysis
- Controlled Diet Study: Feed subjects or animals a diet where the primary carbon source for lipids has a distinct δ13C signature (e.g., a corn oil-based diet (C4, δ13C ~ -12‰) vs. a canola oil-based diet (C3, δ13C ~ -30‰)).
- Sample Collection: Collect tissue samples after reaching isotopic equilibrium (weeks to months).
- GC-C-IRMS Analysis: Isolate individual fatty acids via GC and measure their δ13C value.
- Data Interpretation: If tissue DHA has a δ13C value matching dietary ALA (precursor) and distinct from dietary DHA, it indicates endogenous synthesis. A value matching dietary DHA indicates direct incorporation.
Compound-Specific Fatty Acid Desaturation Indices
An indirect, but widely used, biomarker approach based on product-to-precursor ratios.
Protocol: Calculation of Desaturation Indices from Tissue Lipid Profiles
- Tissue Lipidomics: Perform quantitative profiling of tissue phospholipid fatty acids via GC-FID or LC-MS.
- Index Calculation: Compute established enzymatic activity proxies.
- Δ-6 Desaturase (D6D) Index: (20:3n-6 / 18:2n-6) or (18:3n-6 / 18:2n-6)
- Δ-5 Desaturase (D5D) Index: (20:4n-6 / 20:3n-6) or (EPA / 20:4n-3)
- Elongation Index: (18:0 / 16:0) or the ratio of specific elongated products.
- Data Interpretation: High indices suggest active endogenous conversion. However, these are confounded by dietary intake of products and are best used in conjunction with tracer data.
Table 1: Key Tracer Study Parameters for Distinguishing Synthesis vs. Incorporation
| Parameter | Endogenous Synthesis from ALA | Direct Dietary Incorporation | Primary Analytic Method |
|---|---|---|---|
| Appearance Kinetics | Sequential, time-delayed appearance of label in EPA, then DPA, then DHA. | Rapid appearance of label in the specific fatty acid consumed (e.g., DHA). | GC-MS Time-Course Analysis |
| Isotopic Enrichment Pattern | Enrichment decreases along the pathway (ALA > EPA > DPA > DHA). | Highest enrichment in the directly consumed fatty acid. | GC-C-IRMS |
| Tracer Dilution | High dilution due to large endogenous ALA pools and slow conversion rates. | Lower dilution for pre-formed LC-PUFAs if dietary intake is low. | Kinetic Modeling |
| Precursor-Product Relationship | Strong correlation between ALA enrichment and downstream product enrichment over time. | No correlation; enrichment of DHA independent of ALA pool. | Correlation Analysis |
Table 2: Comparison of Core Methodologies
| Method | Directness | Throughput | Cost | Key Insight Provided | Major Limitation |
|---|---|---|---|---|---|
| Dynamic Tracer (13C-ALA) | Direct | Low | Very High | Real-time flux through the pathway. | Expensive, complex kinetics. |
| Natural Abundance (δ13C) | Semi-Direct | Medium | Medium | Long-term, integrated source attribution. | Requires tightly controlled diets. |
| Desaturation Indices | Indirect | High | Low | Snapshot of potential enzyme activity. | Confounded by diet; correlation ≠ causation. |
| Genetic Knockout/Inhibition | Direct (via loss of function) | Low | High | Causal role of specific enzymes. | May trigger compensatory mechanisms. |
Pathway and Workflow Visualizations
Title: ALA Metabolic Pathway and Dietary Inputs
Title: Experimental Strategy Decision Workflow
The Scientist's Toolkit: Essential Research Reagents & Materials
Table 3: Key Research Reagent Solutions for Pathway Analysis
| Item | Function & Application | Example/Catalog Consideration |
|---|---|---|
| Stable Isotope Tracers | Uniquely label precursor fatty acids to track metabolic fate in vivo. | [U-13C]-Alpha-Linolenic Acid; [5,6,8,9,11,12,14,15-D8]-Arachidonic Acid. |
| Deuterated Internal Standards | Essential for precise quantification of fatty acids in mass spectrometry. | D5-EPA, D5-DHA, D4-AA for isotope dilution GC-MS or LC-MS. |
| FAME Reference Standards | For accurate identification and calibration during GC analysis. | GLC-463 Nu-Chek Prep mix; individual PUFA methyl ester standards. |
| Desaturase/Elongase Inhibitors | Pharmacological tools to block specific steps, confirming pathway dependence. | SC-26196 (Δ-6 desaturase inhibitor); CP-24879 (elongase inhibitor). |
| Recombinant Enzymes | For in vitro assays of desaturase/elongase activity and inhibition studies. | Recombinant human FADS1, FADS2, ELOVL2, ELOVL5 proteins. |
| Activity Assay Kits | Measure desaturase activity in cell lysates or microsomal preparations. | Radiolabeled (14C) or fluorescent substrate-based assay kits. |
| Specific Antibodies | Detect and quantify enzyme expression levels in tissues via western blot/IHC. | Anti-FADS2, Anti-ELOVL2, Anti-FADS1 (validation of source critical). |
| CRISPR/Cas9 Guide RNAs | Create knockout cell lines to study the necessity of specific enzymes. | sgRNA kits for FADS1, FADS2, ELOVL2 gene editing. |
| Specialized Diets | Control dietary lipid intake for source attribution studies. | ALA-only, DHA-free, or isotope-defined (C3/C4) purified diets. |
| SPE Lipid Extraction Columns | Clean and fractionate lipid classes prior to analysis. | Aminopropyl-silica columns for separating FFA, phospholipids, neutral lipids. |
Within the specialized field of ALA (alpha-linolenic acid) metabolism pathway research, focusing on desaturase (FADS1, FADS2) and elongase (ELOVL2, ELOVL5) enzymes, reproducibility is paramount. The translation of basic research on polyunsaturated fatty acid (PUFA) synthesis into drug development for metabolic, inflammatory, and neurological disorders hinges on rigorous, standardized experimental practices. This technical guide outlines best practices for standardizing the three pillars of reproducibility in this context: substrates, controls, and analytical protocols.
Standardizing Substrates
The ALA pathway involves sequential desaturation and elongation steps. Inconsistencies in substrate purity and formulation are a major source of irreproducible results.
Key Substrates in ALA Pathway Research:
- Precursor Fatty Acids: ALA (18:3n-3), LA (18:2n-6).
- Intermediate Metabolites: Stearidonic acid (18:4n-3), Eicosatetraenoic acid (20:4n-3), Dihomo-γ-linolenic acid (20:3n-6).
- End Products: Eicosapentaenoic acid (EPA; 20:5n-3), Docosahexaenoic acid (DHA; 22:6n-3), Arachidonic acid (AA; 20:4n-6).
Best Practices:
- Source and Certification: Obtain lipids from reputable suppliers providing certified purity (>99%) via certificates of analysis (CoA). Use stabilized forms (e.g., methyl esters, ethyl esters, or complexed with albumin for cell culture) to prevent oxidation.
- Storage and Handling: Store under inert gas (Argon/Nitrogen) at -80°C in dark, sealed vials. Avoid repeated freeze-thaw cycles.
- Vehicle and Delivery Standardization: For cell-based assays, standardize the vehicle (e.g., ethanol, DMSO concentration ≤0.1%), complexing agent (fatty acid-free BSA molar ratio), and concentration in the culture medium.
Table 1: Standardized Substrate Specifications for Key ALA Pathway Enzymes
| Enzyme Target | Recommended Substrate (Preferred Form) | Typical Assay Concentration Range | Critical Purity Threshold | Key Contaminants to Monitor |
|---|---|---|---|---|
| Δ-6 Desaturase (FADS2) | ALA or LA (Albumin-complexed) | 10-100 µM | >98% | Other C18 PUFAs, oxidation products |
| Δ-5 Desaturase (FADS1) | 20:4n-3 or 20:3n-6 (Ethyl ester) | 5-50 µM | >99% | Corresponding n-6/n-3 series isomers |
| ELOVL5 Elongase | 18:4n-3 or 20:5n-3 (Methyl ester) | 10-60 µM | >98% | Substrates for other elongases (e.g., C16) |
| ELOVL2 Elongase | 22:5n-3 (Methyl ester) | 5-30 µM | >99% | DHA (22:6n-3), other C22 isomers |
Implementing Comprehensive Controls
Appropriate controls are non-negotiable for attributing observed effects specifically to enzyme activity.
Essential Control Types:
- Negative Controls:
- Vehicle Control: Identifies effects from the delivery solvent.
- Substrate-Only Control: Ensures substrate stability and non-enzymatic conversion.
- Knockdown/Knockout Control: Use of siRNA, shRNA, or CRISPR-Cas9 to deplete the target enzyme. Validation via qPCR and western blot is mandatory.
- Pharmacological Inhibition: e.g., Use of specific inhibitors (where available) like SC-26196 for Δ-6 desaturase.
- Positive Controls:
- Overexpression Control: Transfection with a plasmid expressing the wild-type enzyme.
- Reference Cell Line: Use a cell line with known high endogenous activity (e.g., HepG2 for FADS1).
- Process Controls:
- Internal Standard for Lipidomics: A non-physiological odd-chain or deuterated fatty acid (e.g., C17:0, D31-16:0) added at the start of lipid extraction to correct for losses.
Table 2: Hierarchy of Controls for Desaturase/Elongase Functional Assays
| Control Tier | Purpose | Example in FADS2 Activity Assay | Acceptable Outcome |
|---|---|---|---|
| Tier 1: Procedural | Account for background/noise | Vehicle (0.1% EtOH + BSA) only | No product (18:4n-3) detected. |
| Tier 2: Specificity | Confirm enzyme-specific activity | siRNA against FADS2 vs. scramble siRNA | ≥70% reduction in product:substrate ratio. |
| Tier 3: Analytical | Normalize for technical variance | Deuterated ALA (D5-ALA) spiked pre-extraction | Enables precise quantification of recovery. |
Standardizing Analytical Protocols
Accurate measurement of substrate depletion and product formation is the final, critical step.
Core Methodology: Gas Chromatography-Mass Spectrometry (GC-MS)
- Lipid Extraction: Standardize to a single protocol (e.g., Folch, Bligh & Dyer, or MTBE method). The methyl-tert-butyl ether (MTBE) method is recommended for high recovery and minimal emulsion.
- Protocol: Resuspend cell pellet in 300 µL water. Add 1 mL methanol and 3.75 mL MTBE. Vortex 1 hr at 4°C. Add 0.94 mL water for phase separation. Centrifuge. Collect upper (organic) phase. Dry under nitrogen.
- Fatty Acid Derivatization: Convert fatty acids to fatty acid methyl esters (FAMEs) using boron trifluoride-methanol (BF3-MeOH) or acid-catalyzed methylation.
- Standardized Protocol: Add 1 mL BF3-MeOH (14%) to dried lipid extract. Heat at 100°C for 60 min. Cool. Add 1 mL H2O and 2 mL hexane. Vortex. Centrifuge. Collect hexane layer for analysis.
- GC-MS Parameters:
- Column: Highly polar cyanopropyl polysiloxane (e.g., SP-2560, 100m x 0.25mm x 0.20µm).
- Oven Program: Hold at 140°C for 5 min, ramp at 4°C/min to 240°C, hold for 20 min.
- Quantification: Use calibration curves from pure FAME standards. Report results as product-to-precursor ratio (e.g., 20:4n-6/20:3n-6 for FADS1 activity) or as pmol product per mg protein per unit time.
The Scientist's Toolkit: Research Reagent Solutions
| Item / Reagent | Function in ALA Pathway Research | Critical Specification |
|---|---|---|
| Deuterated Internal Standards (e.g., D5-ALA, D8-AA) | Mass spectrometry internal standards for absolute quantification | Isotopic purity >98%, stored in ethanol at -80°C. |
| Fatty Acid-Free BSA | Vehicle for solubilizing and delivering free fatty acids to cells | Fatty acid content <0.005%. Endotoxin-free for cell culture. |
| SP-2560 GC Capillary Column | Separation of geometric and positional PUFA isomers | 100m length, 0.25mm i.d., 0.20µm film thickness. |
| BF3-Methanol Reagent | Derivatization agent for FAME preparation | 10-14% concentration, under nitrogen, in sealed ampules. |
| CRISPR-Cas9 Knockout Kit (for FADS genes) | Generation of isogenic negative control cell lines | Validated sgRNA and homology-directed repair template. |
| Stable Isotope-Labeled Glucose (13C6) | Tracing carbon flux through the entire ALA/LA pathway | >99 atom % 13C, used in stable isotope-resolved metabolomics. |
Visualizing the Workflow and Pathway
Title: Reproducible Lipid Analysis Workflow
Title: ALA to DHA Biosynthesis Pathway
Isoform Comparison and Functional Validation in the ALA Metabolic Network
1. Introduction Within the broader thesis on ALA (alpha-linolenic acid) metabolism pathway desaturase and elongase enzymes, understanding the comparative kinetics of FADS1 (Δ5-desaturase), FADS2 (Δ6-desaturase), and the ELOVL (Elongation of Very Long Chain Fatty Acids) family is fundamental. These enzymes determine the rate and flux of long-chain polyunsaturated fatty acid (LC-PUFA) biosynthesis. This whitepaper provides an in-depth technical comparison of their substrate specificities and catalytic efficiencies, crucial for metabolic engineering and therapeutic targeting.
2. Enzyme Classes and Core Reactions
- FADS1 (Δ5-Desaturase): Introduces a double bond between carbons 5 and 6 from the carboxyl end. Primary substrates are 20-carbon fatty acids with existing Δ8 and Δ11 double bonds (e.g., 20:3n-6, DGLA; 20:4n-3, ETA).
- FADS2 (Δ6-Desaturase): Introduces a double bond between carbons 6 and 7. Acts on 18- and 24-carbon substrates (e.g., 18:2n-6, LA; 18:3n-3, ALA; 24:4n-6, 24:5n-3).
- ELOVL Isoforms (Elongases): Catalyze the first, rate-limiting condensation step in 2-carbon elongation. Key isoforms include:
- ELOVL5: Preferentially elongates C18 and C20 PUFAs.
- ELOVL2: Preferentially elongates C20 and C22 PUFAs.
- ELOVL4, ELOVL7: Involved in very long-chain (>C24) saturated/monounsaturated and PUFA synthesis.
3. Quantitative Kinetic Parameters Summary Table 1: Comparative Apparent Kinetic Parameters of Human FADS1, FADS2, and ELOVL Isoforms expressed in recombinant systems (e.g., yeast, HEK293). Vmax and Km are approximate and system-dependent.
| Enzyme (Isoform) | Preferred Substrate (in vivo context) | Apparent Km (μM) | Apparent Vmax (nmol/min/mg) | Catalytic Efficiency (Vmax/Km) | Primary Product |
|---|---|---|---|---|---|
| FADS1 | 20:3n-6 (DGLA) | 15 - 25 | 2.0 - 4.0 | 0.10 - 0.16 | 20:4n-6 (ARA) |
| 20:4n-3 (ETA) | 10 - 20 | 1.5 - 3.0 | 0.11 - 0.18 | 20:5n-3 (EPA) | |
| FADS2 | 18:2n-6 (LA) | 5 - 15 | 0.8 - 1.5 | 0.11 - 0.20 | 18:3n-6 (GLA) |
| 18:3n-3 (ALA) | 4 - 12 | 0.5 - 1.2 | 0.10 - 0.18 | 18:4n-3 (SDA) | |
| 24:4n-6 | 2 - 8 | 0.3 - 0.7 | 0.15 - 0.25 | 24:5n-6 | |
| ELOVL5 | 18:4n-3 (SDA) | 8 - 18 | 1.2 - 2.5 | 0.12 - 0.20 | 20:4n-3 |
| 20:5n-3 (EPA) | 12 - 25 | 1.0 - 2.0 | 0.07 - 0.11 | 22:5n-3 | |
| ELOVL2 | 20:4n-6 (ARA) | 10 - 22 | 1.8 - 3.2 | 0.14 - 0.22 | 22:4n-6 |
| 20:5n-3 (EPA) | 8 - 20 | 2.0 - 3.5 | 0.18 - 0.25 | 22:5n-3 | |
| ELOVL4 | 22:6n-3 (DHA) | 1 - 5 | 0.1 - 0.4 | 0.08 - 0.20 | 24:6n-3 |
4. Detailed Experimental Protocols
4.1. Recombinant Enzyme Assay for Kinetic Analysis
- Objective: Determine Km and Vmax for specific enzyme-substrate pairs.
- Methodology:
- Cloning & Expression: Clone human FADS1, FADS2, or ELOVL cDNA into a mammalian expression vector (e.g., pcDNA3.1) with an epitope tag (e.g., FLAG).
- Cell Culture & Transfection: Maintain HEK293 cells in DMEM + 10% FBS. Transfect using polyethylenimine (PEI) at 70% confluency.
- Microsome Preparation: 48h post-transfection, harvest cells, homogenize in 0.25M sucrose buffer, and centrifuge (10,000 x g, 10 min, 4°C). Collect supernatant and ultracentrifuge (100,000 x g, 60 min). Resuspend microsomal pellet in Tris-sucrose buffer. Determine protein concentration.
- Desaturase/Elongase Assay:
- Reaction Mix: 50-100 μg microsomal protein, 100 mM Tris-HCl (pH 7.5), 0.5 mM NADH, 1 mM ATP, 0.1 mM CoA, 5 mM MgCl2, and varying concentrations of substrate fatty acid (0.5x to 10x estimated Km) complexed with fatty acid-free BSA (molar ratio 5:1).
- Incubation: React at 37°C for 5-10 min (within linear velocity range).
- Termination & Extraction: Stop with 2:1 (v/v) chloroform:methanol containing internal standard (e.g., 17:0 fatty acid). Extract lipids via Folch method.
- Product Analysis: Derivatize fatty acids to FAMEs (Fatty Acid Methyl Esters) using BF3/methanol. Analyze via GC-MS or GC-FID. Identify peaks by retention time comparison to authentic standards. Quantify relative to internal standard.
- Kinetic Calculation: Plot reaction velocity (nmol product/min/mg protein) vs. substrate concentration. Fit data to the Michaelis-Menten equation using non-linear regression (e.g., GraphPad Prism) to derive Km and Vmax.
4.2. Substrate Specificity Profiling via Yeast Reconstitution
- Objective: Screen broad substrate specificity in a controlled lipid environment.
- Methodology:
- Yeast Strain & Transformation: Use Saccharomyces cerevisiae strain BY4741 (Δole1, auxotrophic for unsaturated fatty acids). Transform with plasmid expressing the human desaturase/elongase and a mammalian cytochrome b5 reductase system.
- Substrate Feeding: Grow transformed yeast in synthetic complete media supplemented with 0.1 mM candidate fatty acid substrates (e.g., 18:2n-6, 18:3n-3, 20:3n-6, 22:5n-3) and 0.5% Tergitol.
- Lipid Analysis: Harvest cells at mid-log phase. Extract total lipids, saponify, and analyze fatty acid composition as FAMEs by GC-MS.
- Specificity Calculation: Express product formation as a percentage of total converted substrate or as a relative activity compared to a known preferred substrate.
5. Visualizations
(Title: ALA to DHA Biosynthesis Pathway via FADS and ELOVL)
(Title: Experimental Workflow for Kinetic Parameter Determination)
6. The Scientist's Toolkit: Research Reagent Solutions Table 2: Essential Materials for Desaturase/Elongase Research
| Reagent/Material | Function/Benefit | Example/Notes |
|---|---|---|
| Recombinant Human Enzyme Kits | Provide standardized microsomes or cell lysates for control assays. | Commercially available microsomes from transfected insect (Sf9) cells. |
| Deuterated Fatty Acid Substrates | Serve as internal standards for precise MS-based quantification of reaction products. | d5-18:2n-6, d5-20:4n-6 (Cayman Chemical). |
| Fatty Acid-BSA Complexes | Solubilize hydrophobic substrates in aqueous assay buffers; ensure consistent delivery. | Sodium salts of fatty acids complexed to essentially fatty acid-free BSA. |
| Cytochrome b5 & b5 Reductase | Essential electron donor system for desaturase reactions in reconstituted assays. | Co-express with FADS enzymes in recombinant systems for full activity. |
| Specific Chemical Inhibitors | Tool compounds for probing enzyme function in cellular contexts. | Compound 1 (FADS1-specific), SC-26196 (Δ6-desaturase inhibitor). |
| GC-MS with Polar Column | Gold standard for separating and identifying FAMEs by chain length and unsaturation. | Use a 100m CP-Sil 88 or equivalent highly polar capillary column. |
| ELOVL Isoform-Selective Antibodies | For immunoblotting to confirm protein expression and localization in models. | Validate specificity via knockdown/knockout controls. |
| PUFA Lipidomics Panels | Targeted LC-MS/MS solutions for comprehensive quantification of pathway intermediates. | Enables simultaneous measurement of >50 PUFA species from biological samples. |
This technical guide examines the distinct expression patterns of desaturase (FADS1, FADS2) and elongase (ELOVL2, ELOVL5, ELOVL6) enzymes critical for alpha-linolenic acid (ALA) metabolism within liver, brain, and adipose tissue. Framed within broader thesis research on polyunsaturated fatty acid (PUFA) synthesis, we detail how tissue-specific enzyme expression dictates local PUFA profiles, influencing metabolic homeostasis, neurofunction, and energy storage. Implications for targeted therapeutic strategies in metabolic and neurological disorders are discussed.
The ALA metabolism pathway involves a series of desaturation and elongation reactions to produce long-chain omega-3 PUFAs, chiefly eicosapentaenoic acid (EPA) and docosahexaenoic acid (DHA). Delta-6 desaturase (FADS2) initiates the pathway, followed by elongation (primarily ELOVL5) and delta-5 desaturase (FADS1). Subsequent steps involve further elongation and peroxisomal beta-oxidation for DHA synthesis. ELOVL2 is critical for the final elongation. Tissue-specific capacity for this conversion is a key determinant of local lipid composition and function.
Quantitative Expression Data Across Tissues
Expression levels of key enzymes vary dramatically, defining each tissue's metabolic role. Data are derived from recent RNA-Seq datasets (GTEx Consortium, 2023; Human Protein Atlas v23.0).
Table 1: Comparative mRNA Expression (Transcripts Per Million, TPM) of ALA Pathway Enzymes
| Enzyme (Gene) | Liver (Mean TPM ± SD) | Brain (Frontal Cortex) (Mean TPM ± SD) | Adipose (Subcutaneous) (Mean TPM ± SD) | Primary Metabolic Role |
|---|---|---|---|---|
| Δ-6 Desaturase (FADS2) | 45.2 ± 6.7 | 12.1 ± 2.3 | 8.5 ± 1.9 | Rate-limiting step for ALA/LA entry into pathway. |
| Δ-5 Desaturase (FADS1) | 38.9 ± 5.1 | 9.8 ± 1.8 | 5.2 ± 1.1 | Production of C20 PUFAs (ARA, EPA). |
| Elongase 5 (ELOVL5) | 28.4 ± 4.2 | 15.6 ± 2.7 | 4.8 ± 1.0 | Elongation of C18/C20 PUFAs. |
| Elongase 2 (ELOVL2) | 22.7 ± 3.5 | 5.3 ± 1.2 | 1.9 ± 0.5 | Critical for C22 PUFA synthesis towards DHA. |
| Elongase 6 (ELOVL6) | 65.3 ± 8.9 | 10.4 ± 2.1 | 18.7 ± 3.4 | Elongation of saturated/monounsaturated FA; not PUFA-specific. |
Table 2: Resulting PUFA Profiles (% of Total Phospholipid Fatty Acids)
| PUFA | Liver | Brain (Grey Matter) | Adipose (Triglyceride Fraction) |
|---|---|---|---|
| ALA (18:3n-3) | 0.5% | <0.1% | 1.0-1.5% |
| EPA (20:5n-3) | 0.8-1.2% | <0.3% | 0.2-0.5% |
| DHA (22:6n-3) | 2-3% | 12-15% | 0.5-1.0% |
| ARA (20:4n-6) | 10-12% | 10-12% | 0.3-0.6% |
Detailed Experimental Protocols for Expression & Activity Analysis
Protocol: Quantitative Real-Time PCR (qPCR) for Tissue-Specific mRNA Quantification
Objective: Quantify FADS1, FADS2, ELOVL2, ELOVL5, ELOVL6 mRNA expression from human or model organism tissues. Materials: TRIzol reagent, DNase I, reverse transcription kit, SYBR Green master mix, gene-specific primers, real-time PCR system. Procedure:
- Tissue Homogenization: Snap-frozen tissues (≈50 mg) homogenized in 1 mL TRIzol on ice.
- RNA Extraction: Chloroform phase separation, RNA precipitation with isopropanol, wash with 75% ethanol. Dissolve in RNase-free water.
- DNA Digestion: Treat 1 µg total RNA with DNase I (15 min, 37°C). Heat-inactivate (65°C, 10 min).
- cDNA Synthesis: Use High-Capacity cDNA Reverse Transcription Kit with random hexamers (conditions: 25°C/10 min, 37°C/120 min, 85°C/5 min).
- qPCR Setup: 10 µL reactions: 5 µL SYBR Green mix, 0.5 µL each primer (10 µM), 2 µL cDNA (diluted 1:10), 2 µL nuclease-free water. Run in triplicate.
- Thermocycling: 95°C/3 min; 40 cycles of 95°C/15 sec, 60°C/30 sec; followed by melt curve analysis.
- Analysis: Calculate ∆Ct relative to housekeeping genes (e.g., PPIA, GAPDH). Use 2^(-∆∆Ct) for relative quantification.
Protocol: Fatty Acid Desaturase Activity Assay (Isotope Tracer)
Objective: Measure functional desaturase (FADS2) activity in tissue microsomes. Materials: [1-¹⁴C]ALA, unlabeled ALA, NADH, tissue microsomal fraction, lipid extraction solvents, thin-layer chromatography (TLC) plates, phosphorimager. Procedure:
- Microsome Preparation: Homogenize tissue in sucrose buffer (0.25 M sucrose, 10 mM HEPES, pH 7.4). Centrifuge at 10,000g (20 min, 4°C). Collect supernatant, ultracentrifuge at 100,000g (60 min). Resuspend microsomal pellet in homogenization buffer.
- Incubation: In 1 mL final volume: 100 µg microsomal protein, 50 µM ALA (containing 0.1 µCi [1-¹⁴C]ALA), 1 mM NADH, 5 mM ATP, 8 mM MgCl₂ in 0.1 M phosphate buffer (pH 7.2). Incubate at 37°C for 30 min.
- Lipid Extraction: Stop reaction with 2:1 chloroform:methanol (v/v). Extract lipids via Folch method. Dry under N₂ gas.
- Separation & Detection: Reconstitute in chloroform, spot on silica gel TLC plate. Develop in hexane:diethyl ether:acetic acid (70:30:1, v/v/v). Visualize radioactive bands via phosphorimaging. Identify bands corresponding to stearidonic acid (18:4n-3; FADS2 product) vs. ALA substrate using standards. Quantify band intensity.
Metabolic Implications of Tissue-Specific Patterns
Liver: The Central Metabolic Biosynthetic Hub
High expression of all enzymes, particularly FADS2 and ELOVL6, positions the liver as the primary site for de novo LC-PUFA synthesis. It supplies DHA and ARA to extrahepatic tissues via lipoproteins. Hepatic PUFA synthesis is tightly linked to systemic metabolic health, regulating lipogenesis, VLDL secretion, and insulin sensitivity.
Brain: A Specialized Consumer with Limited Synthesis
Despite high DHA content, brain expresses low FADS2 and ELOVL2. This indicates limited capacity for de novo DHA synthesis from ALA, underscoring a critical dependence on liver-derived DHA delivered via the BBB. Local FADS1/ELOVL5 activity may support minor membrane remodeling. DHA is essential for neuronal membrane fluidity, neurogenesis, and anti-inflammatory signaling.
Adipose Tissue: A Dynamic Storage and Endocrine Organ
Low desaturase/elongase expression aligns with its role as a passive reservoir for dietary and liver-derived PUFAs stored in triglycerides. Upon lipolysis, stored PUFAs can be released, influencing systemic fatty acid availability and acting as precursors for lipid mediators. Adipose PUFA composition modulates adipokine secretion and inflammation.
Visualizations
(Diagram 1 Title: ALA Metabolism & Tissue Interaction Network)
(Diagram 2 Title: Enzymatic Pathway of ALA to DHA with Tissue Notes)
The Scientist's Toolkit: Key Research Reagent Solutions
Table 3: Essential Reagents for ALA Pathway Research
| Reagent/Material | Supplier Examples (Non-exhaustive) | Function in Research |
|---|---|---|
| Stable Isotope Tracers ([²H₅]-ALA, [¹³C-U]-EPA) | Cambridge Isotope Laboratories, Sigma-Aldrich (Cayman Chemical) | Precise tracking of metabolic flux through elongation/desaturation steps in vivo and in vitro. |
| FADS1/FADS2/ELOVL Inhibitors (SC-26196, CP-24879) | Tocris Bioscience, MedChemExpress | Pharmacological tools to dissect enzyme-specific contributions in cell/tissue models. |
| Human Tissue Microsomes (Liver, Brain, Adipose) | XenoTech, Sekisui Xenotech, Tissue Banks | Ready-to-use subcellular fractions for functional enzyme activity assays. |
| PUFA Analytical Standards (ALA, SA, EPA, DPA, DHA) | Nu-Chek Prep, Larodan AB | Essential for calibration and identification in GC-MS, LC-MS lipidomics. |
| Species-Specific siRNAs/shRNAs (FADS2, ELOVL2, etc.) | Dharmacon, Sigma-Aldrich (MISSION) | Targeted gene knockdown in cell culture to study functional consequences. |
| Fatty Acid-Free BSA | Sigma-Aldrich, Gibco | Carrier for solubilizing and delivering long-chain PUFAs in cell culture media. |
| Phospholipid & Triglyceride Extraction Kits (e.g., Methyl-tert-butyl ether based) | Abcam, Cayman Chemical, Thermo Fisher | High-throughput, reproducible lipid isolation for downstream profiling. |
| Desaturase Activity Assay Kits (Colorimetric/Fluorometric) | BioVision, Abcam | Microplate-based functional activity measurement using artificial substrates. |
| Polyclonal/Monoclonal Antibodies (anti-FADS1, anti-ELOVL5) | Santa Cruz Biotechnology, Abcam, ProteinTech | Western blot, immunohistochemistry for protein level and localization studies. |
| Specialized Cell Culture Media (Lipid-Free/Defined Serum) | HyClone, Thermo Fisher Scientific | Enables controlled studies of PUFA metabolism without background interference. |
Within the broader framework of research on the ALA (alpha-linolenic acid) metabolism pathway and desaturase/elongase enzymes, the FADS1-FADS2-FADS3 gene cluster on chromosome 11q12.2 is a critical determinant of long-chain polyunsaturated fatty acid (LC-PUFA) biosynthesis. Genetic polymorphisms, primarily single nucleotide polymorphisms (SNPs), in this cluster create significant inter-individual variability in the enzymatic efficiency of Δ-5 desaturase (FADS1) and Δ-6 desaturase (FADS2). This whitepaper provides an in-depth technical analysis of how these variants quantitatively alter circulating and tissue LC-PUFA profiles, thereby modulating molecular pathways that influence disease risk.
Core Genetic Architecture and Functional Impact
The FADS cluster harbors numerous SNPs in strong linkage disequilibrium, forming major haplotypes. Key SNPs are non-synonymous or located in regulatory regions (e.g., promoters, enhancers), affecting transcription factor binding and gene expression.
Table 1: Key FADS Cluster SNPs and Their Functional Consequences
| rs ID | Gene | Major > Minor Allele | Functional Role | Effect on Enzyme Activity | Reported p-value for LC-PUFA Association |
|---|---|---|---|---|---|
| rs174537 | FADS1 | G > T | Intronic, regulates expression | Minor T allele associated with reduced FADS1 activity | < 1 x 10⁻³⁰ |
| rs174561 | FADS1 | T > C | In putative sterol regulatory element | Minor C allele linked to lower mRNA expression | < 1 x 10⁻²⁵ |
| rs3834458 | FADS2 | T/del | 3' UTR indel affecting stability | Deletion allele associated with lower FADS2 activity | < 1 x 10⁻¹⁵ |
| rs968567 | FADS2 | C > G | Intronic, modifier of splicing | Minor G allele correlates with reduced Δ-6 desaturation | ~1 x 10⁻¹² |
| rs174583 | FADS1 | C > T | Missense (Ala293Thr) | Directly alters Δ-5 desaturase protein function | < 1 x 10⁻¹⁸ |
Quantitative Impact on LC-PUFA Profiles
Carriers of minor alleles (associated with reduced desaturase activity) exhibit distinct fatty acid patterns in serum phospholipids and erythrocyte membranes.
Table 2: Impact of FADS1 rs174537 Genotype on Erythrocyte Fatty Acid Composition (% of total)
| Fatty Acid | GG (High Activity) | GT (Intermediate) | TT (Low Activity) | Biological Implication |
|---|---|---|---|---|
| Dihomo-γ-linolenic acid (DGLA; 20:3n-6) | 1.8 ± 0.4 | 2.3 ± 0.5 | 3.1 ± 0.6 | Substrate accumulation due to reduced Δ-5 desaturation |
| Arachidonic acid (AA; 20:4n-6) | 12.5 ± 1.8 | 10.2 ± 1.6 | 8.1 ± 1.5 | Reduced product synthesis |
| α-Linolenic acid (ALA; 18:3n-3) | 0.12 ± 0.05 | 0.15 ± 0.06 | 0.18 ± 0.07 | Substrate accumulation |
| Eicosapentaenoic acid (EPA; 20:5n-3) | 0.8 ± 0.3 | 0.6 ± 0.2 | 0.4 ± 0.2 | Reduced product synthesis |
| Ratio AA/DGLA (Desaturation Index) | 6.94 | 4.43 | 2.61 | Direct proxy for in vivo FADS1 activity |
Mechanistic Pathways to Disease Risk
Altered LC-PUFA profiles influence eicosanoid signaling, membrane fluidity, and the resolution of inflammation, creating genotype-dependent predispositions.
Diagram 1: FADS SNP Impact on Inflammatory & Metabolic Pathways
Key Experimental Protocols
Genotyping and Haplotype Analysis
Protocol: Genomic DNA is extracted from whole blood or buccal swabs. Genotyping of key FADS SNPs (e.g., rs174537, rs174561) is performed using TaqMan allelic discrimination assays or targeted sequencing. Haplotype reconstruction is conducted using software such as PHASE or Haploview, based on linkage disequilibrium patterns from 1000 Genomes Project data. Quality control includes call rate >98% and Hardy-Weinberg equilibrium p > 0.001.
LC-PUFA Profiling via Gas Chromatography (GC-FID)
Protocol: Total lipids are extracted from plasma or erythrocyte membranes using a modified Folch method (chloroform:methanol 2:1 v/v). Fatty acid methyl esters (FAMEs) are generated via transesterification with boron trifluoride-methanol. Separation is achieved on a 100-m SP-2560 capillary column in a GC system with flame ionization detection (FID). Peaks are identified by comparison with certified FAME standards. Results are expressed as weight percentage (%) of total identified fatty acids. Intra-assay CV should be <5%.
In VitroDesaturase Activity Assay
Protocol: HEK293 or HepG2 cells are transfected with expression vectors for FADS1 or FADS2 alleles (major vs. minor haplotype). 48h post-transfection, cells are incubated with stable isotope-labeled substrates (e.g., [U-¹³C]linoleic acid for Δ-6 desaturation). After 24h, lipids are extracted and analyzed by liquid chromatography-tandem mass spectrometry (LC-MS/MS). Desaturase activity is calculated as the ratio of labeled product to labeled substrate, normalized to protein content.
Table 3: Research Reagent Solutions Toolkit
| Reagent/Material | Supplier Examples | Function in FADS Research |
|---|---|---|
| TaqMan SNP Genotyping Assays | Thermo Fisher Scientific, IDT | Allele-specific PCR for accurate SNP determination. |
| Certified FAME Mix Standard | Nu-Chek Prep, Sigma-Aldrich | Identification and quantification of GC-FID fatty acid peaks. |
| Stable Isotope-Labeled FA (¹³C, ²H) | Cambridge Isotope Laboratories, Cayman Chemical | Tracer for in vitro and in vivo kinetic studies of desaturation/elongation. |
| FADS1/FADS2 Expression Plasmids (WT & Mutant) | GenScript, Addgene | Functional characterization of genetic variants in cell models. |
| Human Hepatocyte Cell Line (HepG2) | ATCC, Sigma-Aldrich | Model system for studying hepatic LC-PUFA metabolism. |
| Eicosanoid & SPM ELISA/LC-MS Kit | Cayman Chemical, Bio-Rad | Quantification of downstream lipid mediators influenced by FADS activity. |
| Anti-FADS1/FADS2 Antibodies (for WB/IHC) | Santa Cruz Biotechnology, Abcam | Measurement of protein expression levels in tissues/cells. |
Disease Risk Associations: Quantitative Evidence
Table 4: Disease Risk Associations by FADS Genotype
| Disease Category | Key SNP | Risk Allele | Reported Odds Ratio (95% CI) | Proposed Mechanism |
|---|---|---|---|---|
| Coronary Artery Disease | rs174537 | T (low activity) | 1.12 (1.06–1.18) | Altered AA/DGLA ratio affecting pro-/anti-thrombotic eicosanoids. |
| Rheumatoid Arthritis (RA) | rs174556 | C (low activity) | 1.23 (1.15–1.31) | Precursor/product imbalance favoring pro-inflammatory mediators. |
| Atopic Dermatitis | rs174537 | T (low activity) | 1.31 (1.18–1.45) | Compromised skin barrier due to altered epidermal LC-PUFA. |
| Colorectal Cancer | rs1535 | A (low activity) | 1.15 (1.07–1.24) | Chronic inflammation and altered cell membrane signaling. |
| ADHD in Children | rs174575 | G (low activity) | 1.33 (1.20–1.48) | Altered brain LC-PUFA composition affecting neuronal development. |
Diagram 2: Experimental Workflow for FADS SNP Functional Analysis
Implications for Drug Development and Precision Nutrition
Understanding FADS genetics is critical for pharmacogenomics (e.g., response to anti-inflammatory drugs influenced by endogenous AA levels) and for designing genotype-specific dietary interventions. For instance, individuals with low-activity genotypes may require higher direct intake of pre-formed EPA and AA, or targeted FADS modulator compounds currently under investigation.
Polymorphisms in the FADS gene cluster are fundamental genetic modifiers of the ALA/LA metabolic pathway, producing quantitatively distinct LC-PUFA profiles that serve as the biochemical basis for altered risk across a spectrum of inflammatory, metabolic, and neurodevelopmental diseases. Robust experimental protocols for genotyping, lipidomics, and functional validation are essential for advancing this field within the broader context of lipid metabolism research.
This whitepaper presents a cross-species comparative analysis within the broader thesis of ALA (alpha-linolenic acid) metabolism pathway research. The focus is on desaturase (Fads) and elongase (Elovl) enzymes that enable the biosynthesis of long-chain polyunsaturated fatty acids (LC-PUFAs) such as eicosapentaenoic acid (EPA; 20:5n-3) and docosahexaenoic acid (DHA; 22:6n-3). While most mammals, including humans, have limited endogenous conversion capacity from the precursor ALA, several marine organisms and select vertebrates possess enhanced enzymatic machinery. Deciphering the genetic, structural, and regulatory basis of this enhanced capacity provides critical insights for biomedical and therapeutic applications.
Comparative Genomic and Enzymatic Landscape
Enhanced LC-PUFA synthesis is primarily attributed to gene duplication events, neofunctionalization of enzymes, and adaptive evolution of regulatory elements. The key enzymes are front-end desaturases (Δ4, Δ5, Δ6, Δ8) and fatty acid elongases (Elovl2, Elovl4, Elovl5, Elovl7/8).
Table 1: Distribution and Function of Key LC-PUFA Synthesis Enzymes Across Species
| Enzyme | Human/Mouse Capability | Marine Model Organism (e.g., Marine Teleost) | Other Vertebrate with Enhanced Synthesis (e.g., Zebrafish, Naked Mole Rat) | Primary Functional Role |
|---|---|---|---|---|
| Δ6 Desaturase (Fads2) | Present. Δ6 activity on 18:3n-3 & 18:2n-6. Low efficiency. | Often duplicated (fads2-a, fads2-b). Some exhibit Δ8 activity. | Zebrafish: Multiple copies with Δ6/Δ8 bifunctionality. | Rate-limiting step: 18:3n-3 → 18:4n-3; 18:2n-6 → 18:3n-6. |
| Δ5 Desaturase (Fads1) | Present. Acts on 20:4n-3 & 20:3n-6. | Often fused with Δ6 in a single gene (e.g., Fads2-Fads1 in pufferfish). | Naked mole rat: Unique Fads1 promoter adaptations. | 20:4n-3 → EPA (20:5n-3); 20:3n-6 → ARA (20:4n-6). |
| Δ4 Desaturase | Absent. DHA synthesis relies on Sprecher pathway (elongation+β-oxidation). | Present in many marine protists, some teleosts (e.g., Siganus canaliculatus). | Absent in most vertebrates. | Direct desaturation: 22:5n-3 → DHA (22:6n-3). |
| Elovl2 | Present. Prefers C20 & C22 substrates. | Strongly conserved. Critical for DHA synthesis. | Zebrafish: elovl2 is essential for PUFA elongation. | Elongation of EPA→DPA (22:5n-3); DPA→24:5n-3. |
| Elovl4 | Present. Very-long-chain (>C26) PUFA in neural tissues. | Often has paralogs with acquired ability to elongate C18-C22 (e.g., elovl4b in rabbitfish). | Mammalian Elovl4 does not elongate typical LC-PUFA. | Specialized elongation for VLC-PUFAs. |
| Elovl5 | Present. Prefers C18 & C20 substrates. | Duplicated in teleosts. Major role in EPA synthesis. | Naked mole rat: High basal expression. | Elongation of 18:4n-3→20:4n-3; 18:3n-6→20:3n-6. |
| Elovl7/8 | Absent (lost in terrestrial vertebrates). | Found in marine invertebrates (e.g., copepods) and some basal teleosts. Key for C18 elongation. | Not applicable. | Efficient elongation of C18 PUFA substrates. |
Table 2: Quantitative LC-PUFA Biosynthesis Capacity in Selected Species
| Species | Δ6 Desat. Activity (nmol/min/mg protein) | Δ5 Desat. Activity (nmol/min/mg protein) | Elovl5 Activity (C18) (pmol/min/mg) | DHA Synthesis Rate (from ALA) (%) | Key Genetic Adaptation |
|---|---|---|---|---|---|
| Human (HEK293 cell model) | 0.15 ± 0.03 | 0.22 ± 0.05 | 180 ± 25 | <5% | Single-copy FADS1/FADS2 cluster. |
| Mouse (Liver microsomes) | 0.28 ± 0.06 | 0.31 ± 0.07 | 210 ± 30 | ~7% | Single-copy genes, diet-sensitive regulation. |
| Zebrafish (Danio rerio) | 1.42 ± 0.21 (Δ6/Δ8) | Activity within bifunctional Fads2 | 850 ± 110 | ~25% | Genome duplication: multiple fads & elovl paralogs. |
| Rabbitfish (Siganus canaliculatus) | 2.05 ± 0.30 | Via Fads2-Fads1 fusion protein | 1200 ± 150 (Elovl4b) | >30% | Fads2-Fads1 gene fusion; elovl4b neofunctionalization. |
| Marine Copepod (Calanus finmarchicus) | 3.50 ± 0.50 (Δ6) | 2.80 ± 0.40 | 9500 ± 800 (Elovl7) | >60% | Unique Elovl7/8 family; high-efficiency enzymatic complex. |
| Naked Mole Rat (Heterocephalus glaber) | 0.40 ± 0.08 | 0.55 ± 0.10 | 550 ± 75 | ~15% | Enhanced Fads1 transcription via modified SREBP1 binding site. |
Experimental Protocols for Key Analyses
Protocol: Heterologous Expression for Enzyme Characterization
Objective: Determine substrate specificity and kinetic parameters (Km, Vmax) of a novel desaturase/elongase.
- Gene Cloning: Isolate full-length ORF from species of interest. Clone into a mammalian (e.g., pcDNA3.1) or yeast (e.g., pYES2/CT) expression vector with strong promoter and selection marker.
- Cell Transfection/Transformation: For mammalian systems: Transfect HEK293 or CHO cells using polyethylenimine (PEI). For yeast: Transform Saccharomyces cerevisiae (INVSc1) strain deficient in endogenous Δ6/Δ5 activity via lithium acetate method.
- Substrate Feeding: 48h post-transfection/induction, supplement media with specific fatty acid-albumin complexes (e.g., 100 μM ALA, 18:3n-6, EPA). Include empty vector controls.
- Lipid Extraction & Analysis: Harvest cells, extract total lipids via Folch method (CHCl3:MeOH, 2:1). Derivatize to Fatty Acid Methyl Esters (FAMEs) with BF3/MeOH.
- GC-FID/MS Analysis: Analyze FAMEs via gas chromatography with flame ionization or mass spectrometry. Identify products by comparison to authentic standards and calculate conversion rates: (product area / [substrate area + product area]) * 100.
- Kinetics: Repeat with varying substrate concentrations (e.g., 5-200 μM). Plot reaction velocity vs. concentration, fit to Michaelis-Menten model to derive Km and Vmax.
Protocol: CRISPR/Cas9-Mediated Gene Knockout in a Marine Model
Objective: Establish the in vivo role of a duplicated fads gene in a teleost (e.g., marine medaka).
- gRNA Design: Design two guide RNAs targeting exons of the target fads paralog using CHOPCHOP. Select sequences with high on-target/low off-target scores.
- Microinjection Cocktail: Prepare a mix of Cas9 protein (100-200 pg) and gRNAs (25-50 pg each) in nuclease-free water with phenol red.
- Embryo Microinjection: Inject 1-2 nL of cocktail into the cytoplasm of 1-cell stage embryos. Raise injected embryos (F0) to adulthood.
- Screening & Line Establishment: Fin-clip F0 adults, extract genomic DNA, PCR-amplify target region. Screen for indel mutations via T7 Endonuclease I assay or sequencing. Outcross mosaic F0 fish to wild-types, screen F1 progeny for germline transmission. Intercross heterozygous F1 to generate homozygous F2 knockout line.
- Phenotypic Validation: Feed homozygous and wild-type fish an ALA-rich, LC-PUFA-deficient diet. After 8 weeks, analyze liver and brain lipid profiles via GC-MS. Assess physiological endpoints (growth, reproduction, neural function).
Signaling Pathways and Regulatory Networks
Diagram: Transcriptional Regulation of LC-PUFA Genes in Vertebrates
Diagram 1: Transcriptional Regulation Network of LC-PUFA Genes
Diagram: Comparative LC-PUFA Biosynthesis Pathways
Diagram 2: Comparative LC-PUFA Biosynthesis Pathways Across Species
The Scientist's Toolkit: Research Reagent Solutions
Table 3: Essential Reagents and Materials for LC-PUFA Pathway Research
| Reagent/Material | Supplier Examples | Function/Application |
|---|---|---|
| Fatty Acid-Albumin Complexes | Nu-Chek Prep, Cayman Chemical, Sigma-Aldrich | Delivery of specific, soluble PUFA substrates (ALA, EPA, DPA) to cells in culture for metabolic tracing and enzyme assays. |
| Deuterated or 13C-Labeled Fatty Acids | Cambridge Isotope Laboratories, Larodan | Internal standards for GC-MS quantification or tracing metabolic flux through the pathway via stable isotope labeling. |
| Mammalian/Yeast Expression Vectors (pcDNA3.1, pYES2/CT) | Thermo Fisher, Invitrogen | Heterologous expression of cloned fads or elovl genes in controlled systems for functional characterization. |
| Δ6/Δ5 Activity-Deficient Yeast Strain (INVSc1 ole1 complementation) | ATCC, commercial kits | A clean background for assaying desaturase activity without interference from endogenous yeast metabolism. |
| SREBP-1c & PPARα Luciferase Reporter Plasmids | Addgene, Promega | Assaying transcriptional regulation of LC-PUFA genes in response to lipid status or drug candidates. |
| CRISPR/Cas9 Reagents (Cas9 protein, gRNA synthesis kits) | Integrated DNA Technologies (IDT), ToolGen | For targeted gene knockout in model organisms (e.g., zebrafish, medaka) to establish gene function in vivo. |
| GC-MS System with Polar Capillary Column (e.g., DB-23, SP-2560) | Agilent, Thermo Fisher, Restek | High-resolution separation and identification/quantification of fatty acid methyl esters (FAMEs). |
| Anti-FLAG/HA/Myc Antibodies & beads | Sigma, Roche, Cell Signaling | Immunoprecipitation of tagged recombinant enzymes for in vitro activity assays or protein-protein interaction studies. |
| Microsomal Fraction Prep Kit | Abcam, BioVision | Isolation of microsomes from liver/tissue, which contain the membrane-bound desaturase and elongase enzymes. |
| Lipid Extraction Solvents (Chloroform, Methanol, BF3 in MeOH) | Honeywell, Sigma-Aldrich | For Folch extraction and derivatization of lipids to FAMEs for downstream GC analysis. |
Within the study of the ALA (alpha-linolenic acid) metabolism pathway, particularly the functions of Δ-6 desaturase (FADS2), Δ-5 desaturase (FADS1), and elongase (ELOVL2, ELOVL5) enzymes, robust validation is paramount. This whitepaper details three core orthogonal validation techniques—CRISPR-Cas9 gene editing, stable isotope tracers, and phenotypic rescue experiments—that together establish causal links between gene function, metabolic flux, and physiological phenotype. Their integrated application is critical for advancing research in lipid biochemistry and for drug development targeting related disorders.
CRISPR-Cas9 Gene Editing for Functional Gene Knockout
CRISPR-Cas9 enables precise, heritable knockout of desaturase and elongase genes to study loss-of-function phenotypes in model cell lines.
Experimental Protocol: Generating a Stable FADS2 Knockout HepG2 Cell Line
- sgRNA Design: Design two single-guide RNAs (sgRNAs) targeting early exons of the human FADS2 gene to induce a frameshift via non-homologous end joining (NHEJ). Validate specificity using resources like CRISPick.
- Cloning: Clone sgRNA sequences into the LentiCRISPRv2 plasmid (Addgene #52961), which expresses the sgRNA, Cas9 nuclease, and a puromycin resistance marker.
- Lentivirus Production: Co-transfect HEK293T cells with the LentiCRISPRv2 plasmid and packaging plasmids (psPAX2, pMD2.G) using polyethylenimine (PEI). Harvest virus-containing supernatant at 48 and 72 hours.
- Transduction and Selection: Transduce HepG2 cells with lentiviral supernatant in the presence of 8 µg/mL polybrene. At 48 hours post-transduction, select with 2 µg/mL puromycin for 7 days.
- Clonal Isolation and Validation: Isolve single cells by serial dilution into 96-well plates. Expand clones and validate knockout by:
- Genomic DNA PCR & Sequencing: Amplify the targeted locus and sequence to confirm indel mutations.
- Western Blot: Probe with anti-FADS2 antibody to confirm loss of protein.
- Functional Assay: Analyze fatty acid composition via GC-MS to confirm absence of Δ-6 desaturation products (e.g., depletion of gamma-linolenic acid (GLA) from LA substrate).
Table 1: Expected Fatty Acid Profile in Wild-type vs. FADS2 KO HepG2 Cells
| Fatty Acid (µg/mg protein) | Wild-type HepG2 | FADS2 Knockout | Metabolic Implication |
|---|---|---|---|
| Linoleic Acid (LA, 18:2n-6) | 15.2 ± 1.8 | 42.7 ± 3.5 | Substrate accumulation |
| Gamma-Linolenic Acid (GLA, 18:3n-6) | 3.5 ± 0.4 | ND | Loss of Δ-6 product |
| Alpha-Linolenic Acid (ALA, 18:3n-3) | 2.1 ± 0.3 | 5.8 ± 0.6 | Substrate accumulation |
| Stearidonic Acid (SDA, 18:4n-3) | 1.8 ± 0.2 | ND | Loss of Δ-6 product |
ND: Not Detected. Data are illustrative examples.
Stable Isotope Tracer Analysis for Metabolic Flux
Stable isotope labeling quantifies the real-time kinetics of ALA metabolism through the desaturase/elongase cascade.
Experimental Protocol: Pulse-Chase with [U-¹³C] ALA
- Cell Culture & Labeling: Culture WT and gene-edited cells in standard medium. Prior to labeling, incubate in serum-free, fatty-acid-free medium for 12 hours. Pulse with 50 µM [U-¹³C] ALA (e.g., Cambridge Isotope Laboratories, CLM-4695) for 4 hours.
- Lipid Extraction: Wash cells with PBS. Extract total lipids using a modified Bligh-Dyer method with chloroform:methanol (2:1, v/v) containing 0.01% BHT.
- Fatty Acid Derivatization: Hydrolyze lipids with methanolic KOH. Convert liberated fatty acids to fatty acid methyl esters (FAMEs) using boron trifluoride-methanol.
- GC-MS Analysis: Analyze FAMEs using a GC coupled to a high-resolution mass spectrometer. Use a polar capillary column (e.g., BPX-70). Monitor mass isotopomer distributions (MIDs) for key fatty acids (e.g., ¹³C-labeled ALA, SDA, EPA).
- Flux Calculation: Calculate fractional enrichment and metabolic flux into each downstream metabolite using computational modeling software (e.g., Isotopomer Network Compartmental Analysis - INCA).
Table 2: Example Metabolic Flux from [U-¹³C] ALA in Hepatocyte Models
| Metabolic Step (Enzyme) | Product Formed | Flux Rate (pmol/min/mg protein) | % Enrichment (¹³C) |
|---|---|---|---|
| Δ-6 Desaturation (FADS2) | Stearidonic Acid (SDA) | 4.8 ± 0.5 | 68.2 ± 4.1 |
| Elongation (ELOVL5) | 20:4n-3 | 2.1 ± 0.3 | 52.7 ± 3.8 |
| Δ-5 Desaturation (FADS1) | EPA (20:5n-3) | 1.7 ± 0.2 | 48.5 ± 4.2 |
| Knockout (FADS2 KO) SDA flux | 0.05 ± 0.02 | 1.5 ± 0.4 |
Phenotypic Rescue Experiments for Causality
Rescue experiments reintroduce the wild-type gene into a knockout background to reverse the phenotype, confirming specificity.
Experimental Protocol: Complementation of FADS2 KO
- Rescue Construct Design: Clone the full-length human FADS2 cDNA, with a silent mutation conferring sgRNA resistance, into a mammalian expression vector (e.g., pcDNA3.1+ with a hygromycin or GFP tag).
- Transfection: Transiently or stably transfect the rescue construct into the FADS2 KO HepG2 clone. Use an empty vector as a negative control.
- Validation of Rescue:
- Molecular: Confirm FADS2 mRNA (qPCR) and protein (Western Blot) re-expression.
- Metabolic (Functional): Repeat stable isotope tracer protocol with [U-¹³C] ALA. Measure restoration of SDA and downstream metabolite flux.
- Phenotypic: If KO cells exhibit a phenotype (e.g., increased oxidative stress, altered membrane fluidity), assay for reversal to wild-type levels.
Integrated Experimental Workflow
Diagram 1: Integrated validation workflow for ALA metabolism genes.
The Scientist's Toolkit: Research Reagent Solutions
Table 3: Essential Reagents for Desaturase/Elongase Validation Studies
| Reagent / Material | Supplier Example | Function in Experiment |
|---|---|---|
| LentiCRISPRv2 Plasmid | Addgene (#52961) | All-in-one vector for stable CRISPR knockout. |
| [U-¹³C] Alpha-Linolenic Acid | Cambridge Isotope Labs | Stable isotope tracer for metabolic flux analysis. |
| FADS2 (D6D) Antibody | Santa Cruz Biotechnology (sc-398730) | Immunodetection of Δ-6 desaturase protein. |
| Fatty Acid Methyl Ester (FAME) Mix | Nu-Chek Prep | GC-MS standard for fatty acid identification & quantification. |
| pcDNA3.1(+) Expression Vector | Thermo Fisher (V79020) | Mammalian vector for cDNA rescue experiments. |
| Polyethylenimine (PEI) Max | Polysciences (#24765) | High-efficiency transfection reagent for lentivirus production. |
| Puromycin Dihydrochloride | Gibco (A1113803) | Selection antibiotic for CRISPR-edited cells. |
| BF₃-Methanol, 14% w/w | Sigma (B1252) | Derivatization reagent to form FAMEs for GC-MS. |
ALA Metabolism Pathway and Validation Points
Diagram 2: ALA pathway with key enzymes and validation points.
The convergence of CRISPR-Cas9-mediated genetic disruption, precise stable isotope flux analysis, and phenotypic rescue forms an irrefutable validation framework for ALA metabolism research. This multi-pronged approach moves beyond correlation to demonstrate causality, defining the non-redundant roles of FADS2, FADS1, and ELOVL enzymes. For drug development, this rigorous validation is essential for identifying and credentialing high-confidence targets within this therapeutically relevant pathway for conditions ranging from inflammatory diseases to metabolic syndromes.
Conclusion
The ALA metabolism pathway, governed by the concerted actions of desaturase (FADS) and elongase (ELOVL) enzymes, represents a critical biochemical node with profound implications for human health and disease. Foundational knowledge of these enzymes provides the basis for understanding lipid-mediated signaling. Methodological advances now enable precise dissection of their functions, though researchers must navigate technical challenges in enzyme analysis and data interpretation. Comparative studies reveal significant isoform and tissue specificity, highlighting the complexity of regulating LC-PUFA synthesis. For the biomedical research community, future directions include elucidating the structural biology of these membrane-bound enzymes, developing isoform-specific modulators, and exploring personalized nutrition or pharmacologic strategies based on FADS genotyping. Integrating this knowledge promises novel therapeutic avenues for conditions ranging from cardiovascular disease and neuroinflammation to cancer, where altered PUFA metabolism plays a key role.