GC-IMS vs. Electronic Nose: A Comparative Guide to Advanced Volatile Compound Analysis for Food Quality and Safety
This article provides a comprehensive comparative analysis of Gas Chromatography-Ion Mobility Spectrometry (GC-IMS) and Electronic Nose (E-Nose) technologies for food quality assessment.
GC-IMS vs. Electronic Nose: A Comparative Guide to Advanced Volatile Compound Analysis for Food Quality and Safety
Abstract
This article provides a comprehensive comparative analysis of Gas Chromatography-Ion Mobility Spectrometry (GC-IMS) and Electronic Nose (E-Nose) technologies for food quality assessment. Tailored for researchers and industry professionals, it explores the fundamental principles, distinct methodological approaches, and diverse applications of both techniques in analyzing volatile organic compounds (VOCs). The content addresses key challenges, optimization strategies, and validation metrics, offering a clear framework for selecting the appropriate technology based on specific analytical needs—from rapid, on-line screening with E-Nose to high-resolution, compound-specific identification with GC-IMS. By integrating insights from current research and real-world case studies across various food matrices, this guide serves as a vital resource for advancing food safety, authenticity, and flavor science.
Understanding the Core Technologies: Principles of GC-IMS and E-Nose in VOC Analysis
Gas Chromatography-Ion Mobility Spectrometry (GC-IMS) represents a powerful analytical technique that combines the superior separation capabilities of gas chromatography with the rapid detection and high sensitivity of ion mobility spectrometry. This technology has gained significant traction in food quality assessment research as it enables robust analysis of volatile organic compounds (VOCs) that constitute the flavor and aroma profiles of various food products [1]. The fundamental working principles of GC-IMS revolve around three core processes: chromatographic separation, chemical ionization, and drift-time based detection, which together create a highly effective system for volatile compound analysis.
When positioned within the broader context of analytical techniques for food quality assessment, GC-IMS emerges as a compelling alternative to electronic nose (e-nose) systems, each with distinct advantages and limitations. While e-nose technology provides rapid fingerprinting of overall odor profiles using an array of non-specific chemical sensors, GC-IMS offers detailed compound separation and identification capabilities [2]. This critical distinction positions GC-IMS as an indispensable tool for researchers requiring not just pattern recognition but precise molecular characterization of volatile compounds in complex food matrices.
Fundamental Operating Principles of GC-IMS
Gas Chromatography Separation Stage
The analytical process begins with the gas chromatography separation stage, where a sample is introduced into the GC system and vaporized. The resulting vaporized compounds are transported by an inert carrier gas through a chromatographic column containing a stationary phase [3]. During this process, different compounds interact with the stationary phase to varying degrees, causing them to elute at different retention times based on their chemical properties and affinity for the stationary phase [1]. This separation mechanism effectively distributes complex mixtures into temporally resolved individual components as they exit the GC column.
The separation efficiency in GC is quantified by theoretical plates, which is significantly influenced by the interface design between the GC and IMS components. Research indicates that the ratio between the internal volume of the IMS reaction region and the internal volume of the GC column is a critical parameter affecting overall separation performance [3]. To optimize this relationship, GC-IMS systems often employ larger diameter columns (typically 320 μm or 530 μm) or multi-capillary columns (MCC) consisting of multiple capillaries, which combine higher internal volume with low mass transfer resistance [3]. This initial separation dimension is crucial for reducing ionization competition in subsequent stages and minimizing matrix effects that could compromise detection.
Ionization Process and Mechanisms
Following GC separation, the eluted compounds enter the ionization region of the IMS, where neutral molecules are converted into ions for detection. The most common ionization method in commercial IMS systems is atmospheric pressure chemical ionization (APCI) utilizing beta-emitting sources such as tritium (³H) [4]. These sources emit beta particles that initiate a gas-phase reaction cascade with the drift gas (typically nitrogen or clean air), resulting in the formation of proton-water clusters (H⁺[H₂O]ₙ) known as reactant ions [4].
When analyte molecules with higher proton affinity than water molecules enter the ionization region, they undergo proton transfer reactions with the reactant ions, forming protonated monomers (MH⁺[H₂O]ₙ₋ₓ) [4]. As analyte concentration increases, proton-bound dimers (M₂H⁺[H₂O]ₘ₋ₓ) may form through the attachment of additional analyte molecules. The number of water molecules (n) in these clusters depends on the gas temperature and moisture content within the ionization region [4]. This ionization process is remarkably sensitive, capable of detecting volatile organic compounds at trace concentration levels, sometimes as low as parts-per-trillion [4].
Ion Separation in the Drift Tube
After ionization, the generated ions are pulsed into the drift tube through a gating mechanism (typically a Bradbury-Nielsen or field switching shutter) that creates precise ion packets [3] [4]. Within the drift tube, ions are subjected to a uniform electric field (typically 200-500 V/cm) and accelerate toward a Faraday plate detector. During their trajectory, ions continuously collide with neutral drift gas molecules flowing in the opposite direction, creating a resistive force [4].
The equilibrium between electric acceleration and collisional deceleration results in ions moving with constant velocity characteristics of their mobility. Ion mobility (K) is defined by the Mason-Schamp equation and depends on the ion's mass, charge, and collision cross section (CCS) - a measure of the ion's three-dimensional structure [4]. Compact ions experience fewer collisions and thus have higher mobilities and shorter drift times, while bulkier ions with larger collision cross sections have lower mobilities and longer drift times [3]. This separation mechanism enables IMS to distinguish between isomeric compounds that have identical mass but different structures, providing an orthogonal separation dimension to GC.
Detection and Data Representation
As ions reach the detector following their drift journey, they generate a current signal at the Faraday plate that is recorded over time. The resulting data is represented in a two-dimensional spectrum with GC retention time on the x-axis and IMS drift time on the y-axis [3]. Signal intensity is typically represented by a color gradient or contour lines, creating a visualization similar to topographic maps.
The drift time (td) is used to calculate the reduced ion mobility (K₀), which is standardized against the reduced mobility of a known reference compound to enable comparisons between different instruments and conditions [4]. The resolving power of IMS is defined as the ratio between drift time and the full width at half maximum (fwhm) of the ion peak, with values ranging from approximately 50 for compact instruments to over 1000 for ultra-high-end systems [3]. This two-dimensional separation approach provides peak capacities ranging from 35 to 650 for a sub-second separation, making GC-IMS highly effective for analyzing complex volatile mixtures [3].
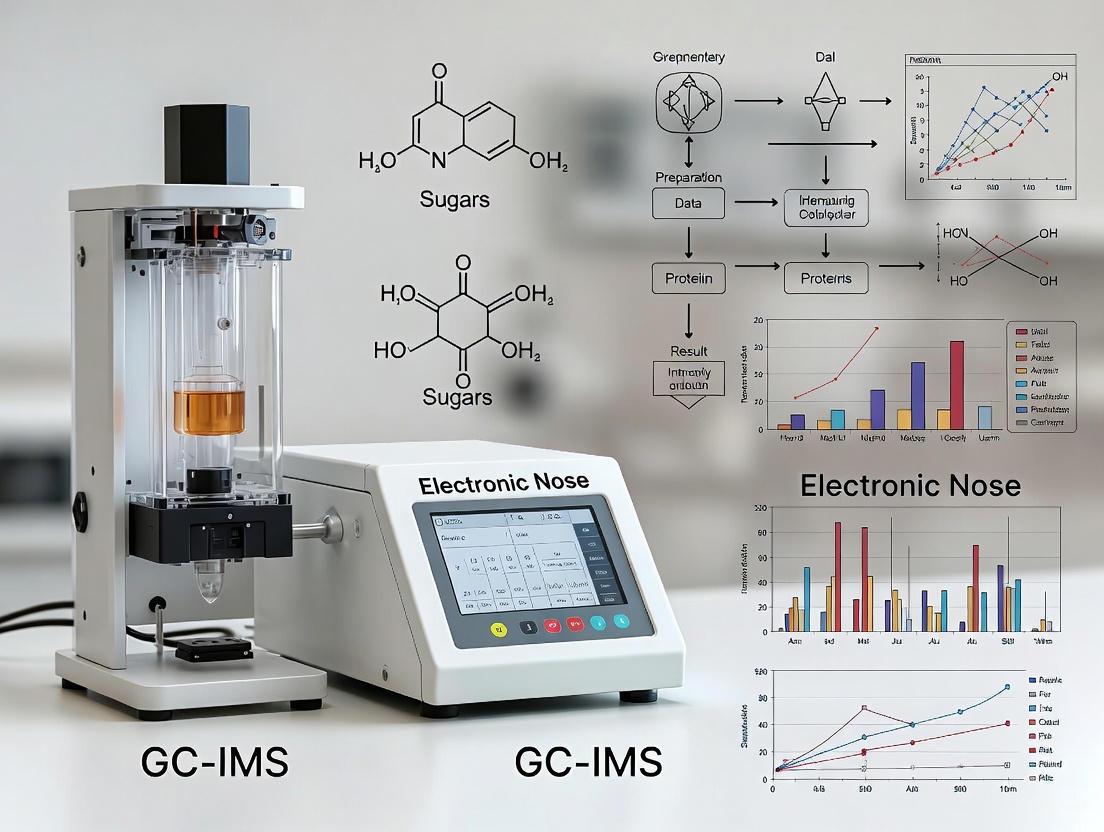
Figure 1: GC-IMS Operational Workflow illustrating the sequential processes of chromatographic separation, ionization, and drift time-based detection.
Comparative Experimental Analysis: GC-IMS vs. Electronic Nose
Technical Principle Comparison
The fundamental differences between GC-IMS and e-nose technologies originate from their distinct operational principles and analytical capabilities. While both techniques analyze volatile compounds, their approaches to separation, detection, and data output differ significantly, making them complementary rather than competitive technologies for many food quality assessment applications.
Table 1: Fundamental Technical Principles Comparison Between GC-IMS and Electronic Nose
| Parameter | GC-IMS | Electronic Nose (E-nose) |
|---|---|---|
| Separation Mechanism | Two-dimensional separation: GC (retention time) + IMS (drift time) [3] [1] | No physical separation; array of non-specific sensors [2] |
| Detection Principle | Chemical ionization + mobility-based ion separation [4] | Changes in electrical properties (resistance, capacitance) of sensor materials [2] |
| Ionization Source | Radioactive (³H, ⁶³Ni) or corona discharge [4] | Not applicable |
| Data Output | 2D/3D spectra (retention time, drift time, intensity) [3] | Pattern recognition based on sensor array response [2] |
| Compound Identification | Direct identification via retention index and reduced mobility (K₀) [4] | Indirect classification based on fingerprint patterns [2] |
| Orthogonal Information | Collision cross section (CCS) and mobility data [4] | Response patterns from multiple sensor technologies |
Performance Metrics in Food Quality Assessment
Experimental studies across various food matrices demonstrate the complementary strengths and limitations of GC-IMS and e-nose technologies. The selection between these techniques depends largely on the specific analytical requirements—whether the application demands compound identification or rapid pattern recognition.
Table 2: Performance Comparison in Food Quality Assessment Applications
| Performance Metric | GC-IMS | Electronic Nose (E-nose) |
|---|---|---|
| Sensitivity | Parts-per-billion (ppb) to parts-per-trillion (ppt) levels [4] | Parts-per-million (ppm) to ppb levels [2] |
| Analysis Time | 10-30 minutes (including GC separation) [5] | Several seconds to minutes [2] |
| Identification Capability | Specific compound identification with reference standards [1] | No compound identification; classification only [2] |
| Sample Preparation | Minimal (often headspace injection) [5] [4] | Minimal to none [2] |
| Matrix Effect Resistance | Moderate (reduced by GC separation) [3] | Low to moderate (susceptible to humidity/temperature) [2] |
| Quantification Ability | Good linearity for targeted compounds [4] | Semi-quantitative for classes of compounds [2] |
Application-Specific Experimental Data
Recent research has provided quantitative data comparing the performance of GC-IMS and e-nose technologies in specific food quality assessment scenarios. These experimental findings highlight the contextual advantages of each technique and their synergistic potential when used together.
Table 3: Experimental Results from Comparative Food Quality Studies
| Food Matrix | GC-IMS Performance | E-nose Performance | Reference |
|---|---|---|---|
| Soybean Paste | Identified 111 volatile flavor compounds; detected acids, alcohols, and ketones as key contributors [6] | Effectively distinguished overall odor profiles of different samples [6] | Yang et al., 2025 [6] |
| Infant Formula | Detected 41 volatile compounds including 12 aldehydes, 11 ketones, 9 esters [5] | Sensors W5S, W1S, W2S showed highest response values [5] | 2022 Study [5] |
| Raw Milk | Identified pyridine, nonanal, dodecane, furfural as geographical markers [7] | Effectively distinguished Southern vs. Northern China origins [7] | 2023 Study [7] |
| Amomi Fructus | Detected 111 VOCs; 101 identified; 47 differential markers for authenticity [8] | Achieved 100% authenticity classification accuracy when combined with GC-IMS [8] | Frontiers Study, 2025 [8] |
Detailed Experimental Protocols
Standard GC-IMS Analysis Methodology
A typical GC-IMS experimental protocol for food quality assessment involves several standardized steps to ensure reproducibility and analytical rigor:
Sample Preparation: Solid or semi-solid food samples are often homogenized, with 1-2 grams transferred to a 20 mL headspace vial. For liquid samples, 3-8 mL is typically used. Samples may be diluted with saturated sodium chloride solution (300 g/L) to modify vapor pressure and enhance volatile release [5] [9].
Headspace Incubation: Samples are incubated at 40°C for 15-30 minutes with constant agitation (500-960 rpm) to achieve equilibrium between the sample matrix and headspace [5].
GC Separation Conditions:
- Injection temperature: 200-250°C
- Column type: MXT-5 (15 m × 0.53 mm × 1.0 μm) or similar non-polar capillary column
- Carrier gas: Nitrogen or hydrogen (99.999% purity)
- Temperature program: Isothermal at 60°C or ramped from 40°C to 200°C at 5-10°C/min [5]
IMS Analysis Parameters:
- Drift gas: Nitrogen or purified air (99.999% purity)
- Drift tube temperature: 45-60°C
- Electric field strength: 200-500 V/cm
- Drift tube length: 5-10 cm
- Ionization source: Tritium (³H, 300 MBq) or ⁶³Ni [3] [4]
Electronic Nose Analysis Protocol
For comparative studies, e-nose analysis typically follows this protocol:
Sample Preparation: Consistent with GC-IMS preparation to enable direct comparison [5].
Headspace Generation: 5-10 mL sample volume in 20 mL vials, incubated at 40°C for 10-15 minutes without agitation [5].
Sensor Array Exposure:
- Injection volume: 1-5 mL of headspace
- Injection flow rate: 150-300 mL/min
- Measurement time: 120-200 seconds per sample
- Sensor cleaning: 300-600 seconds between samples with purified air [5] [2]
Data Acquisition: Response values from all sensors recorded throughout exposure period, with maximum response or steady-state values used for analysis [5].
Data Processing and Statistical Analysis
Both GC-IMS and e-nose data require multivariate statistical analysis for meaningful interpretation:
GC-IMS Data Processing:
- Use of specialized software (LAV, GC-IMS Library Search)
- Peak detection and alignment using Reporter and Gallery plot plugins
- VOC identification based on retention index and reduced mobility (K₀) references
- 3D visualization and fingerprint comparison [5] [8]
E-nose Data Processing:
- Sensor response normalization (typically to maximum value)
- Feature extraction (maximum response, area under curve, slope)
- Pattern recognition using PCA, LDA, or PLS-DA [2]
Statistical Analysis:
- Principal Component Analysis (PCA) for unsupervised pattern recognition
- Partial Least Squares-Discriminant Analysis (PLS-DA) for supervised classification
- Orthogonal Partial Least Squares-Discriminant Analysis (OPLS-DA) to identify marker compounds
- Hierarchical Cluster Analysis (HCA) for sample grouping [6] [8]
Figure 2: Comparative Experimental Workflow for GC-IMS and Electronic Nose Technologies in Food Quality Assessment
Research Reagent Solutions and Essential Materials
Successful implementation of GC-IMS and e-nose technologies requires specific reagents, materials, and instrumentation. The following table details essential components for establishing these analytical capabilities in research settings.
Table 4: Essential Research Materials and Reagent Solutions for Volatile Compound Analysis
| Category | Specific Items | Function/Purpose | Technical Specifications |
|---|---|---|---|
| Consumables | 20 mL Headspace Vials | Sample containment and volatile accumulation | Glass vials with PTFE/silicone septa [5] |
| GC-IMS Certified Septa | Maintain headspace integrity during incubation/injection | Low VOC background, high-temperature resistant [9] | |
| Saturated NaCl Solution | Modify matrix vapor pressure for enhanced VOC release | 300 g/L in deionized water [5] [9] | |
| Reference Standards | n-Ketones C4-C9 (RI Calibration) | Retention index calibration for GC separation | >98% purity, prepared in appropriate solvents [4] |
| External Quality Control Standards | System performance verification | Certified reference materials for target VOCs [4] | |
| Gases | Carrier Gas (N₂ or H₂) | GC mobile phase for compound transport | High purity (99.999%) with moisture/hydrocarbon traps [3] |
| Drift Gas (N₂ or purified air) | IMS drift tube counter-flow for ion separation | High purity (99.999%) with moisture traps [3] | |
| Instrumentation | GC-IMS System | VOC separation, ionization, and detection | FlavorSpec or similar with tritium ionization source [5] |
| Electronic Nose | Pattern-based odor profiling | PEN3 or similar with metal oxide sensor array [5] | |
| Software | GC-IMS Library Suite | VOC identification and data processing | LAV software with GC-IMS Library Search [5] |
| Chemometrics Packages | Multivariate statistical analysis | SIMCA, The Unscrambler, or R/Python with appropriate packages [8] |
GC-IMS technology represents a sophisticated analytical approach that provides detailed molecular information about volatile compounds through its orthogonal separation mechanism combining gas chromatography and ion mobility spectrometry. The fundamental working principles—separation, ionization, and drift time measurement—enable specific compound identification and quantification at trace levels, distinguishing it from electronic nose technology that provides rapid but non-specific odor profiling.
For food quality assessment research, the choice between GC-IMS and e-nose depends fundamentally on the analytical objectives: GC-IMS excels when compound-specific identification and quantification are required, while e-nose offers advantages for rapid screening and pattern recognition applications. The experimental data presented demonstrates that these technologies frequently provide complementary information, with integrated approaches offering the most comprehensive solution for challenging analytical problems in food science, pharmaceutical development, and quality control applications.
The continuing evolution of both GC-IMS and e-nose technologies, coupled with advanced data fusion algorithms and machine learning approaches, promises enhanced capabilities for quality assessment, authenticity verification, and innovative research across multiple scientific disciplines.
Electronic nose (E-nose) technology represents a groundbreaking approach to odor analysis by mimicking the biological olfactory system. An E-nose is defined as an instrument consisting of an array of electronic chemical sensors with partial specificity and an appropriate pattern recognition system capable of recognizing simple or complex odors [10]. Since its conceptualization in 1982, researchers have sought to develop technologies that could detect and recognize odors and flavors through stages similar to human olfaction [11]. The fundamental principle relies on reproducing human senses using sensor arrays and pattern recognition systems, functioning as a non-separative mechanism where an odor or flavor is perceived as a global fingerprint [11]. This bio-inspired approach has revolutionized quality control processes across various industries, particularly in food quality assessment, where it provides a rapid, non-destructive alternative to traditional analytical methods like gas chromatography-mass spectrometry (GC-MS) and GC-ion mobility spectrometry (GC-IMS).
The correlation between artificial olfaction and human olfaction begins with similar functional architecture. In humans, odorant molecules bind to olfactory receptors in the nasal epithelium, sending signals through neurons to the olfactory bulbs and then to the cerebral cortex for interpretation [12]. Similarly, in E-noses, sensor arrays detect volatile compounds and transduce chemical information into electrical signals that pattern recognition algorithms interpret [12]. This biological inspiration extends to the very structure of the sensing systems, with researchers developing artificial olfactory receptor cells and neural processing units modeled on vertebrate olfactory systems to improve performance, stability, and sensitivity [13].
E-Nose System Architecture: A Tripartite Biological Model
Core System Components
The architecture of an electronic nose mirrors the biological olfactory system through three primary units that work in concert, much like the human nose and brain.
Sample Delivery System: This component acts as the "inhalation mechanism" for the E-nose. It enables the generation of the headspace (volatile compounds) of a sample and injects this headspace into the detection system under constant operating conditions [11]. In practical applications, this often involves headspace vials, incubation systems that heat samples to specific temperatures (typically 40-85°C), and mechanisms for introducing the volatilized compounds to the sensors [14] [5].
Detection System (Sensor Array): Serving as the artificial olfactory epithelium, this reactive part contains the sensor set that responds to volatile compounds through changes in electrical properties [11]. Most E-noses employ chemical sensor arrays that react to volatile compounds on contact, where adsorption causes a physical change of the sensor [11]. The sensor array typically consists of multiple different sensor types, each with partial specificity, creating a composite response pattern for each odorant mixture.
Computing System (Pattern Recognition): This component functions as the artificial olfactory cortex, processing the combined responses from all sensors [11]. It performs global fingerprint analysis using various data interpretation systems including artificial neural networks (ANN), fuzzy logic, chemometric methods, and other pattern recognition modules [11]. This system is responsible for transforming raw sensor data into identifiable odor patterns by comparing them against established databases.
Bio-Inspired Sensor Array Technologies
The sensor array forms the frontline of odor detection in E-nose systems, with various technologies emulating the diversity and sensitivity of biological olfactory receptors.
Metal-Oxide-Semiconductor (MOS) Sensors: Among the most commonly used sensors, MOS devices contain a metal oxide coating with electrical resistance that changes in the presence of target gases [11]. These sensors offer high chemical stability, low response to moisture, long life, and reasonable price, making them particularly suitable for food quality applications [12]. The PEN3 E-nose system, used in food quality studies, typically incorporates 10 MOS sensors, each with different sensitivity profiles to various volatile organic compounds [14] [5].
Conducting Polymer Sensors: These organic polymers conduct electricity and change their resistance when exposed to specific volatile compounds [11]. While generally more sensitive than MOS sensors at room temperature, they may have shorter lifespans and different application profiles.
Bioelectronic Noses: Representing the cutting edge of bio-inspiration, these systems use actual olfactory receptor proteins cloned from biological organisms. One research group has developed a bio-electronic nose that mimics human olfactory signaling systems with exceptional sensitivity, detecting odors at femtomolar concentrations [11]. These systems offer unparalleled specificity by leveraging the natural selectivity of biological receptors.
Additional Sensor Technologies: Other sensor types include quartz crystal microbalance (QCM) sensors, which measure mass per unit area through changes in quartz crystal resonator frequency; surface acoustic wave (SAW) sensors, which rely on modulation of surface acoustic waves; and polymer composites formulated with conducting materials like carbon black [11]. Some advanced devices combine multiple sensor types to leverage the strengths of each technology, resulting in significantly more sensitive and efficient devices [11].
Table 1: E-Nose Sensor Technologies and Their Characteristics
| Sensor Type | Working Principle | Sensitivity | Applications in Food Quality |
|---|---|---|---|
| Metal-Oxide-Semiconductor (MOS) | Changes in electrical resistance of metal oxide layer | Moderate to high | Broad-range detection of volatiles in dairy, meat, spices [12] [5] |
| Conducting Polymers | Changes in electrical conductivity | High | Fruit ripeness, spoilage detection [11] |
| Quartz Crystal Microbalance (QCM) | Changes in resonance frequency due to mass adsorption | High | Laboratory analysis of specific aroma compounds [11] |
| Surface Acoustic Wave (SAW) | Modulation of acoustic waves | High | Environmental monitoring, complex odor mixtures [11] |
| Bioelectronic Noses | Protein-ligand binding with transduction | Extremely high (femtomolar) | Medical diagnostics, premium food authentication [11] |
Bio-Inspired Pattern Recognition: The Artificial Olfactory Brain
Computational Architecture Modeled on Biological Systems
The pattern recognition component of E-noses represents perhaps the most sophisticated aspect of bio-inspiration, with computational architectures directly modeled on neural processing in biological olfactory systems.
Research in biologically inspired pattern recognition has led to the development of an Artificial Olfactory Receptor Cells Model (AORCM) inspired by neural circuits of the vertebrate olfactory system [13]. This model comprises multiple layers: the sensory transduction layer, sensory adaptation layer, artificial olfactory receptors layer (AORL), and artificial olfactory cortex layer (AOCL) [13]. Each layer directly corresponds to elements of biological olfactory processing, working together to improve E-nose performance, stability, and sensitivity over extended periods.
Insect olfactory systems have also provided powerful models for computational approaches. One study demonstrated a bio-inspired spiking network modeled on the insect olfactory system that achieved 92% classification accuracy for 20 chemicals using only 30 seconds of sensor data [15]. This system employed 43 virtual receptors to mimic insect olfactory processing and used a delay line architecture to handle continuous data without precise onset timing cues [15].
Classification Algorithms and Chemometric Methods
The pattern recognition systems employed in E-noses can be broadly categorized into linear and nonlinear approaches, each with distinct advantages for specific applications.
Linear Methods include principal component analysis (PCA), linear discriminant analysis (LDA), partial least squares (PLS) regression, and principal component regression (PCR) [12]. These unsupervised learning techniques reduce the dimensions of raw data linearly while preserving maximum information in the new dataset and explaining variance with classification accuracy. PCA was identified as the most widely used technique in a systematic review of E-nose applications [2]. In practical applications, LDA has demonstrated impressive performance, correctly classifying 164 out of 165 samples of sesame oil adulterated with maize oil [12].
Nonlinear Methods include artificial neural networks (ANN), fuzzy logic, support vector machines (SVM), and probabilistic neural networks (PNN) [12]. These supervised learning approaches require training datasets but once properly trained, provide rapid, consistent adulteration prediction. Research has shown that appropriate signal processing with an increased number of sensory receptors can significantly improve odor recognition in E-noses, leading to the development of biologically inspired computational models that outperform traditional approaches [13].
Table 2: Pattern Recognition Algorithms Used in E-Nose Systems
| Algorithm | Type | Key Advantages | Reported Performance in Food Applications |
|---|---|---|---|
| PCA (Principal Component Analysis) | Linear, Unsupervised | Dimensionality reduction, data visualization | Most widely used technique [2] |
| LDA (Linear Discriminant Analysis) | Linear, Supervised | Effective class separation | 94.5% accuracy for sesame oil adulteration detection [12] |
| SVM (Support Vector Machines) | Nonlinear, Supervised | Effective in high-dimensional spaces | Used in complex food matrix analysis [12] |
| ANN (Artificial Neural Networks) | Nonlinear, Supervised | Pattern learning, adaptability | Used in meat quality monitoring and spoilage detection [11] |
| Bio-Inspired Spiking Networks | Nonlinear, Supervised | Handles continuous real-time data | 92% accuracy for 20 chemicals [15] |
Comparative Performance: E-Nose vs. GC-IMS in Food Quality Assessment
Experimental Protocols and Methodologies
Direct comparative studies provide the most insightful data on the performance characteristics of E-nose versus GC-IMS technologies. A comprehensive study examining star anise essential oils (SAEOs) extracted using four different methods (hydrodistillation, ethanol solvent extraction, supercritical CO2, and subcritical extraction) employed E-nose, GC-MS, and GC-IMS in parallel to establish a performance benchmark [14].
The experimental protocol for E-nose analysis typically involves placing 2-8 mL of sample into headspace injection bottles (40 mL volume) and allowing equilibrium between 50-300 seconds at temperatures ranging from 20-40°C [14] [5]. For the PEN3 E-nose system, standard parameters include a flush time of 80 seconds, measurement time of 100 seconds, zero-point trim time of 10 seconds, pre-sampling time of 5 seconds, with chamber flow and initial injection flow rates of 450 mL/min and 300 mL/min respectively [14]. The instrument contains 10 metal oxide sensors whose response values are recorded for subsequent pattern recognition analysis.
In parallel, GC-IMS analysis requires smaller sample volumes (typically 100 μL) injected in splitless mode after incubation at 85°C for 5-30 minutes [14]. The separation occurs using a non-polar capillary column with a temperature program, and nitrogen (99.99% purity) serves as both carrier and drift gas. The LAV software processes the data to create volatile compound fingerprints [14].
Performance Metrics and Application Outcomes
The comparative study of extraction methods for star anise essential oils yielded quantitative data on the effectiveness of each analytical technology. While all three techniques (E-nose, GC-MS, and GC-IMS) successfully distinguished SAEOs extracted using different methods, researchers identified GC-IMS as the most suitable approach due to its optimal balance of accuracy and rapidity [14]. This finding is particularly significant given the context of food quality assessment, where both reliability and speed are critical operational parameters.
In practical applications, E-nose technology has demonstrated remarkable sensitivity in various food quality scenarios. The technology achieved up to 99.0% sensitivity in 2015 according to a systematic review, while E-tongue systems reached 100% sensitivity in 2012 [2]. In specific food applications, E-nose systems achieved a maximum average sensitivity of 15% in apple analysis, while E-tongues reached 40.5% in water samples [2]. The technology has proven particularly effective in authenticity verification, with LDA demonstrating 83.6% classification accuracy for camellia seed oil and 94.5% for sesame oil adulterated with maize oil [12].
Table 3: Performance Comparison of Analytical Techniques in Food Quality Assessment
| Parameter | E-Nose | GC-IMS | GC-MS |
|---|---|---|---|
| Analysis Time | 10-20 minutes | 20-40 minutes | 30-60 minutes |
| Sample Preparation | Minimal (headspace generation) | Moderate (incubation) | Extensive (SPME for some samples) |
| Sensitivity | Up to 99.0% [2] | Higher than E-nose [14] | Highest (reference method) |
| Identification Capability | Pattern-based, not compound-specific | Volatile compound identification | Specific compound identification and quantification |
| Qualitative/Quantitative | Primarily qualitative | Semi-quantitative | Fully quantitative |
| Distinguishing Extraction Methods | Effective [14] | Most suitable [14] | Effective [14] |
| Instrument Cost | Moderate | Moderate-High | High |
Research Reagent Solutions and Essential Materials
Successful implementation of E-nose technology requires specific reagents and materials optimized for bio-inspired sensor arrays and pattern recognition. The following table details essential components for experimental work in this field.
Table 4: Essential Research Reagents and Materials for E-Nose Experiments
| Item | Function/Application | Specification Notes |
|---|---|---|
| Metal Oxide Sensors | Core detection element for MOS-based E-noses | PEN3 system uses 10 different MOS sensors; selective for various volatile classes [5] |
| Headspace Vials | Sample containment and volatile accumulation | 20-40 mL volume; sealed with PTFE/silicone septa; compatible with autosampler systems [14] |
| Carrier Gases | Transport volatiles to sensor array | Synthetic air (99.99% pure) for sensor operation; Nitrogen for GC-IMS applications [14] [12] |
| Reference Odorants | System calibration and validation | Pure chemical standards for sensor calibration; concentration series for sensitivity determination |
| Data Acquisition Software | Sensor response recording | Converts analog sensor signals to digital data; proprietary systems like Win Muster for PEN3 [5] |
| Chemometrics Software | Pattern recognition analysis | MATLAB, R, Python with scikit-learn; specialized packages for PCA, LDA, ANN algorithms [12] |
| Temperature Control System | Sample incubation | Maintains precise temperature (40-85°C) for headspace generation; water baths or heating blocks [14] |
E-nose technology, with its bio-inspired architecture combining sensor arrays and pattern recognition systems, has established itself as a powerful tool for food quality assessment. The tripartite structure—sample delivery, detection, and computing systems—effectively mimics biological olfaction while providing practical advantages of rapid analysis, non-destructive testing, and operational simplicity. When compared with analytical techniques like GC-IMS and GC-MS, E-noses demonstrate complementary strengths particularly suited to rapid screening applications where pattern recognition rather than compound-specific identification is prioritized.
The future development of E-nose technology continues to draw inspiration from biological systems, with research focusing on improved sensor arrays with greater specificity and stability, enhanced pattern recognition algorithms capable of handling complex real-world odor scenarios, and miniaturization for portable applications. As these bio-inspired systems evolve, they promise to further bridge the gap between biological olfactory capabilities and instrumental analysis, expanding their role in food quality assessment, environmental monitoring, medical diagnostics, and beyond.
Key Technical Specifications and Operational Parameters for Each System
This guide provides an objective comparison of Gas Chromatography-Ion Mobility Spectrometry (GC-IMS) and Electronic Nose (E-nose) systems for food quality assessment. GC-IMS offers superior compound separation and identification, making it ideal for detailed fingerprinting in research. E-nose excels in rapid, on-site quality control, mimicking human olfaction for high-throughput screening. Understanding their distinct technical specifications enables researchers to select the optimal tool based on required sensitivity, specificity, and operational context.
The following table summarizes the core technical specifications and performance parameters of GC-IMS and E-nose systems.
Table 1: Key Technical Specifications and Performance Comparison
| Parameter | GC-IMS | Electronic Nose (E-nose) |
|---|---|---|
| Primary Function | Separation, detection, and identification of volatile organic compounds (VOCs) [16] [10] | Pattern recognition of overall volatile profile or "fingerprint" [17] [18] |
| Detection Principle | Gas chromatography coupled with ion mobility spectrometry (drift time measurement) [14] [16] | Array of semi-selective chemical sensors with cross-sensitivity [18] [19] |
| Detection Limit | Parts-per-trillion (ppt) to parts-per-billion (ppb) range [20] | Parts-per-million (ppm) to parts-per-billion (ppb) range [17] |
| Analysis Speed | Minutes to tens of minutes (e.g., ~10-40 min) [14] [16] | Seconds to minutes (e.g., < 5 min) [17] [19] |
| Sample Preparation | Often minimal; headspace injection [5] [16] | Typically minimal; direct headspace sampling [19] |
| Identification Capability | High (via GC retention time and IMS drift time) [14] [10] | Low to none; classifies patterns, not individual compounds [17] [2] |
| Quantification | Semi-quantitative to quantitative [16] | Semi-quantitative (relative concentration) [19] |
| Key Strengths | High sensitivity, excellent separation of isomers, visual fingerprinting, minimal sample prep [14] [16] [10] | Extreme speed, portability, ease of use, cost-effectiveness, suitable for online monitoring [17] [18] [19] |
| Key Limitations | Limited linear dynamic range, cannot analyze non-volatile compounds [16] | Sensor drift over time, lower sensitivity, affected by humidity/temperature, limited specificity [18] [19] |
| Operational Cost | Higher (carrier/drift gases, maintenance) | Lower |
| Ideal Application | Research: Detailed VOC profiling, origin traceability, spoilage mechanism studies, authentication [14] [16] | Quality Control: Rapid screening, freshness evaluation, spoilage detection, process monitoring [17] [19] |
System Operation and Data Analysis Workflows
The fundamental operational workflows for GC-IMS and E-nose systems differ significantly, from sample introduction to data interpretation, as illustrated below.
Key Data Analysis Techniques
Both technologies rely on chemometrics and pattern recognition to interpret complex data [17] [19].
- Principal Component Analysis (PCA): The most widely used technique for both GC-IMS and E-nose data [14] [2]. It reduces data dimensionality, allowing visualization of natural clustering and discrimination between samples on a 2D or 3D score plot.
- Linear Discriminant Analysis (LDA): A supervised method that maximizes the separation between known sample groups. Effectively used with both GC-IMS and E-nose for classification tasks like origin authentication [14] [19].
- Artificial Neural Networks (ANNs) & Support Vector Machines (SVM): Non-linear algorithms often employed for complex pattern recognition and building predictive models, especially with E-nose data [17] [18] [19].
Experimental Protocols for Instrument Comparison
A representative experimental protocol from a study comparing extraction methods for Star Anise Essential Oil (SAEO) demonstrates how both instruments are used in parallel for a comprehensive analysis [14].
Table 2: Key Research Reagent Solutions
| Item | Function in the Experiment |
|---|---|
| Star Anise (Illicium verum) | Primary biological material for essential oil extraction [14]. |
| Hydrodistillation (HD) Setup | Traditional method for extracting essential oils using water [14]. |
| Supercritical CO₂ (SCD) System | Advanced, non-thermal extraction method using supercritical carbon dioxide [14]. |
| Headspace Vials (20-40 mL) | Sealed containers for volatile compound sampling [14] [5]. |
| Internal Standards (for GC-MS) | Compounds used for quantification and quality control in chromatographic analysis. |
Detailed Methodology
1. Sample Preparation:
- SAEOs are extracted using four different methods: Hydrodistillation (HD), Ethanol Solvent Extraction (ESE), Supercritical CO₂ (SCD), and Subcritical Extraction (SE) [14].
- For analysis, a precise amount of each SAEO sample (e.g., 2 mL for E-nose, 100 μL for GC-IMS) is placed into a headspace vial and allowed to equilibrate at a controlled temperature to generate a stable headspace [14].
2. E-Nose Data Acquisition:
- Instrument: PEN3 E-nose (Airsense Analytics) with a 10-sensor metal oxide (MOS) array [14].
- Parameters: Sample volume: 2 mL; equilibration time: 50 min at 20°C; measurement time: 100 s; flush time: 80 s; injection flow rate: 300 mL/min [14].
- Procedure: The device's needle aspirates the headspace gas and delivers it to the sensor array. The response of each sensor is recorded over time, creating a unique fingerprint for each sample [14].
3. GC-IMS Data Acquisition:
- Instrument: GC-IMS FlavourSpec (G.A.S.) [14].
- Parameters: Sample volume: 100 μL; incubation: 5 min at 85°C; injection temperature: 85°C; GC column: FS-SE-54-CB-1 (15 m); column temperature: 40°C; drift gas flow: 150 mL/min [14].
- Procedure: The headspace sample is automatically injected into the GC column where VOCs are separated. Subsequently, molecules are ionized and separated in the drift tube based on size, shape, and charge. A 3D topographic plot (retention time, drift time, intensity) is generated [14].
4. Data Analysis:
- Raw data from both instruments are processed using dedicated software (e.g., LAV for GC-IMS) [14] [5].
- PCA and LDA are applied to the response data from both the E-nose sensor array and the GC-IMS topographic plots to visualize and statistically discriminate between the SAEOs from different extraction methods [14].
Application Scenarios in Food Quality Assessment
The choice between GC-IMS and E-nose depends on the specific research or quality control objective. The following table outlines their performance in common applications.
Table 3: Application-Based Performance Comparison
| Application | GC-IMS Performance & Utility | E-Nose Performance & Utility |
|---|---|---|
| Geographical Origin Authentication | High utility. Detects trace VOC differences tied to "terroir" [16]. | Moderate utility. Effective when combined with robust pattern recognition models [19]. |
| Freshness & Spoilage Detection | High utility. Identifies specific spoilage markers (e.g., aldehydes, ketones) for mechanistic understanding [5] [16]. | High utility. Ideal for rapid, non-destructive screening of spoilage onset without identifying specific compounds [19]. |
| Process Monitoring | Moderate utility. Off-line analysis provides detailed snapshots of process-induced flavor changes [10]. | High utility. Potential for at-line or in-line monitoring due to speed and automation [17] [19]. |
| Adulteration Detection | High utility. High specificity can identify unexpected compounds or altered VOC ratios indicative of adulteration [14] [10]. | High utility. Effective for detecting gross adulteration by comparing overall fingerprint to a authentic reference [19]. |
GC-IMS and E-nose are powerful but distinct tools for food quality assessment. GC-IMS is a hyphenated technique that provides high-resolution, sensitive, and informative data for targeted research and method development. The E-nose is a rapid-screening tool that excels in high-throughput quality control and process monitoring where speed and cost are critical. The combination of both techniques, as demonstrated in the experimental protocol, can provide a complete picture—both the detailed chemical composition and the overall sensory-relevant fingerprint—offering a powerful strategy for comprehensive food quality analysis.
Strengths and Inherent Limitations of Each Technology for Food Analysis
In the pursuit of ensuring food quality, safety, and authenticity, analytical technologies play a pivotal role. Among the various methods available, Gas Chromatography-Ion Mobility Spectrometry (GC-IMS) and Electronic Nose (E-nose) systems have emerged as powerful tools for volatile compound analysis. Framed within a broader thesis comparing these technologies for food quality assessment, this guide provides an objective comparison of their performance. GC-IMS combines high-resolution separation with sensitive detection, offering detailed molecular information, while E-nose systems provide rapid, on-site fingerprinting of complex aromas. Understanding the distinct strengths and limitations of each technology is essential for researchers and scientists to select the appropriate method for specific applications in food analysis, from raw material inspection to final product quality control. This article leverages current experimental data to delineate the operational boundaries and optimal use cases for GC-IMS and E-nose systems, providing a foundational resource for professionals in drug development and related fields [14] [10].
Gas Chromatography-Ion Mobility Spectrometry (GC-IMS)
GC-IMS is a two-dimensional analytical technique that separates volatile organic compounds (VOCs) based on two distinct physical properties. In the first dimension, a gas chromatography (GC) column separates compounds based on their partitioning between a gaseous mobile phase and a stationary phase, which is influenced by their molecular weight, polarity, and vapor pressure. Following GC separation, the analytes are ionized, typically by a tritium or corona discharge source, to produce molecular ions. These ions are then introduced into a drift tube for the second dimension of separation. Within the drift tube, which is filled with an inert drift gas (e.g., nitrogen), ions are propelled by a weak, homogeneous electric field. Their drift velocity is determined by their collisional cross-section (CCS), a measure of their size and shape, allowing for differentiation of isomeric and structurally similar compounds that GC alone might not resolve. The resulting spectra provide a fingerprint of the sample's volatile composition with high sensitivity and specificity [10] [21].
Electronic Nose (E-nose)
The Electronic Nose is an intelligent system designed to mimic the mammalian olfactory system. It does not separate individual compounds but instead provides a holistic response to a complex odor mixture. At its core is an array of non-specific chemical sensors, each with partial sensitivity to a range of VOCs. Common sensor technologies include:
- Metal Oxide Semiconductors (MOS): Change electrical resistance upon adsorption of gas molecules.
- Conducting Polymers (CP): Alter electrical conductivity when interacting with VOCs.
- Quartz Crystal Microbalances (QCM): Measure mass changes through shifts in resonant frequency.
- Optical and Electrochemical sensors.
When exposed to a sample's headspace, the sensor array produces a collective response pattern, or "aroma fingerprint." This multidimensional data is processed by a pattern recognition system—often employing machine learning algorithms like Principal Component Analysis (PCA), Linear Discriminant Analysis (LDA), or Artificial Neural Networks (ANNs)—to identify, classify, or quantify the odor. The primary strength of the E-nose lies in its speed and ability to assess overall sample quality without needing to identify individual constituents [22] [10] [23].
Table 1: Core Operational Principles of GC-IMS and E-Nose
| Feature | GC-IMS | Electronic Nose (E-nose) |
|---|---|---|
| Analytical Principle | Two-dimensional separation (Chromatography & Ion Mobility) | Array-based sensing & pattern recognition |
| Data Output | 2D/3D spectra (Retention time vs. Drift time vs. Intensity) | Multidimensional response pattern from sensor array |
| Key Measured Parameters | Retention Index (RI), Collisional Cross-Section (CCS), Intensity | Relative resistance, conductivity, frequency, or current change |
| Information Level | Identifies and quantifies specific volatile compounds | Provides a holistic "fingerprint" of the overall aroma profile |
| Sample Introduction | Typically headspace (HS) injection, often automated | Direct headspace sampling, non-destructive |
Comparative Workflow Analysis
The following diagram illustrates the fundamental operational workflows for both GC-IMS and E-nose systems, highlighting the key stages from sample introduction to result interpretation.
Diagram 1: Comparative Workflows of GC-IMS and E-Nose
Performance Comparison: Strengths and Limitations
A critical evaluation based on recent research reveals a complementary profile of capabilities and constraints for GC-IMS and E-nose systems. The following table summarizes the core performance characteristics of each technology.
Table 2: Comparative Strengths and Limitations of GC-IMS and E-Nose
| Performance Characteristic | GC-IMS | Electronic Nose (E-nose) |
|---|---|---|
| Sensitivity | High (ppt-ppb range) [21] | Moderate to High (compound-dependent) [22] |
| Selectivity & Specificity | Very High (dual separation mechanism) [10] | Low to Moderate (cross-reactive sensors) [22] |
| Analysis Speed | Minutes to tens of minutes [14] [10] | Seconds to minutes [22] [10] |
| Qualitative Capability | Excellent (compound identification via RI & CCS) [21] | None (does not identify individual compounds) [10] |
| Quantitative Capability | Good to Excellent (with calibration) [10] | Semi-Quantitative (requires extensive training) [23] |
| Sample Throughput | Moderate (limited by run time) | Very High (rapid analysis cycle) [22] |
| Portability / On-Site Use | Limited (benchtop systems) | Excellent (portable devices available) [22] |
| Operational Complexity | Higher (requires trained personnel) | Lower (designed for ease of use) [23] |
| Key Strength | Accurate identification and quantification of volatiles in complex mixtures. | Rapid, non-destructive classification and quality grading. |
| Inherent Limitation | Slower, more complex operation, not suited for on-site use. | Cannot identify specific compounds; results can be affected by environmental factors. |
In-Depth Analysis of Key Differentiators
Sensitivity and Selectivity: GC-IMS excels in analyzing complex food matrices due to its two-dimensional separation. The initial GC separation reduces the complexity of the mixture entering the IMS drift tube, which then further resolves compounds based on size, shape, and charge. This makes it particularly powerful for distinguishing isobars and isomers, which are common in food aromas [10] [21]. In contrast, an E-nose's sensor array is inherently cross-reactive. While this is advantageous for creating a unique fingerprint, it can lead to signal overlapping in very complex samples, reducing its effective selectivity compared to GC-IMS [22].
Speed and Throughput: The most significant advantage of the E-nose is its rapid analysis cycle, often completed within a minute. This makes it ideal for high-throughput environments like quality control lines in food processing, where decisions on acceptance or rejection must be made in real-time [22] [23]. GC-IMS, while faster than traditional GC-MS, still requires a longer analysis time (typically 10-30 minutes) to achieve chromatographic separation, limiting its use for real-time process monitoring [14] [10].
Data Interpretation and Information Depth: GC-IMS provides compound-specific information, allowing researchers to link specific analytes (e.g., geosmin in water, hexanal in spoiled meat) to quality attributes. This is crucial for understanding the biochemical pathways behind spoilage or flavor development [10]. The E-nose provides a black-box model; it can reliably indicate that a sample is spoiled or is of a certain grade, but it cannot explain which compounds are responsible for that classification without supplemental analytical techniques [10] [23].
Experimental Evidence and Application Protocols
Case Study: Discrimination of Essential Oils and Baijiu
A seminal study directly comparing these technologies focused on distinguishing Star Anise Essential Oils (SAEOs) extracted by four different methods (Hydrodistillation, Ethanol Solvent Extraction, Supercritical CO2, and Subcritical Extraction). The research employed E-nose, GC-MS, and GC-IMS, combined with multivariate statistical analysis.
Experimental Protocol: SAEOs were analyzed using a PEN3 E-nose with a 10-sensor array. For GC-IMS, a FlavourSpec instrument was used with 100 μL injection volume. The data from both instruments were processed using PCA and LDA [14].
Key Findings: While all techniques could distinguish the extraction methods, the study concluded that GC-IMS was the most suitable method because of its accuracy and rapidity. It successfully established detailed fingerprints of the volatile components, identifying anethole and limonene as the main compounds in all SAEOs, albeit in different proportions that the GC-IMS could clearly visualize [14].
Similarly, in the analysis of different aroma types of Baijiu (Chinese liquor), a combination of E-nose, HS-SPME-GC-MS/MS, and HS-GC-IMS was used. The E-nose provided a rapid differentiation of the Baijiu types, while the GC-IMS technique identified 35, 29, 8, and 12 key volatile components in Sauce-flavor, Thick Sauce-flavor, Strong-flavor, and Light-flavor samples, respectively. This combination provided both a rapid classification and a deep understanding of the compositional differences driving the aroma profiles [21].
Detailed Experimental Methodology
The following table outlines the key reagents and materials required for a typical comparative analysis of food volatiles using these technologies, as derived from the cited studies.
Table 3: Essential Research Reagents and Materials for Food Volatile Analysis
| Item Name | Function / Application | Experimental Context |
|---|---|---|
| PEN3 E-nose (Airsense) | Electronic nose system with a 10-metal oxide sensor array for volatile fingerprinting. | Used for rapid discrimination of SAEOs [14] and Baijiu types [21]. |
| FlavourSpec GC-IMS (G.A.S.) | Benchtop system for combined gas chromatography and ion mobility spectrometry. | Used for detailed volatile profiling of SAEOs [14] and Baijiu [21]. |
| Headspace Vials (e.g., 40 mL) | Containers for volatile equilibrium between sample matrix and headspace. | Standard for both E-nose and GC-IMS sample introduction [14] [21]. |
| HP-5MS Capillary GC Column | Low-polarity stationary phase column for separation of volatile organic compounds. | Used in GC-MS analysis; analogous columns (e.g., FS-SE-54-CB-1) are used in GC-IMS [14]. |
| High-Purity Nitrogen Gas (≥99.99%) | Serves as the drift gas in the IMS drift tube, influencing ion separation and drift time. | Essential consumable for GC-IMS operation [14] [21]. |
| Internal Standard (e.g., o-Dichlorobenzene) | A compound of known concentration used to correct for analytical variability. | Added to samples in GC-MS and GC-IMS for quantitative or semi-quantitative analysis [21]. |
| SPME Fiber (e.g., DVB/CAR/PDMS) | Solid-phase microextraction fiber for concentrating headspace volatiles for GC-MS. | Used for sample preparation in HS-SPME-GC-MS protocols [21]. |
Data Output and Visualization
The data output from these two technologies is fundamentally different. A typical GC-IMS result is presented as a three-dimensional topographic plot (retention time vs. drift time vs. signal intensity) or as a 2D top-view fingerprint where color intensity represents concentration. This allows for direct visual comparison of complex samples and the identification of marker compounds [14] [10]. In contrast, E-nose data is typically visualized using multivariate plots such as PCA or LDA score plots, which show the clustering of different sample groups based on their overall aroma profile, demonstrating patterns of similarity or dissimilarity [14] [22].
GC-IMS and E-nose technologies offer distinct and highly complementary profiles for food quality assessment. GC-IMS is the definitive choice when the research objective requires detailed molecular information, such as identifying specific spoilage markers, authenticating origins based on unique chemical signatures, or optimizing processes by tracking key aroma compounds. Its strength lies in its high sensitivity and powerful dual-separation mechanism [14] [10]. Conversely, the E-nose is unparalleled for applications demanding speed and high-throughput, such as inline quality control on a production line, rapid screening for spoilage, or classification of products based on predefined quality grades. Its portability and ease of use further make it suitable for field applications [22] [23].
The future of food quality assessment lies not in selecting one technology over the other, but in their strategic integration. The research community is moving towards hybrid approaches and data fusion strategies, where the rapid screening capability of the E-nose is combined with the confirmatory, detailed analysis of GC-IMS. Furthermore, trends such as the integration of Artificial Intelligence (AI) and machine learning for advanced pattern recognition and predictive modeling, the miniaturization of GC-IMS components, and the development of more stable and selective sensor materials for E-noses are poised to enhance the capabilities of both technologies, pushing the frontiers of food analysis [22] [24] [23]. For researchers, the optimal path forward involves a clear understanding of the analytical question at hand, leveraging the speed of the E-nose for screening and the power of GC-IMS for in-depth investigation.
Volatile organic compounds (VOCs) are carbon-based chemicals with high vapor pressure and low boiling points that readily evaporate at ambient temperatures, serving as fundamental components of food aroma and flavor profiles [25]. In food science, VOCs function as critical biomarkers for assessing quality, authenticity, freshness, and safety across diverse food matrices [26]. The comprehensive analysis of food VOCs has advanced significantly with the development of sophisticated detection technologies, particularly gas chromatography-ion mobility spectrometry (GC-IMS) and electronic nose (e-nose) systems, which offer complementary approaches for volatile compound characterization [27] [14]. This review systematically compares the operational principles, applications, and performance of GC-IMS and e-nose methodologies for VOC analysis in food products, providing researchers with experimental data and technical insights to inform analytical protocol selection.
Analytical Technologies for VOC Detection
Gas Chromatography-Ion Mobility Spectrometry (GC-IMS)
GC-IMS combines the separation power of gas chromatography with the detection sensitivity of ion mobility spectrometry, enabling high-resolution analysis of volatile compounds. The technique separates VOCs in a capillary column based on their partition coefficients between mobile and stationary phases, followed by ionization and time-based separation of ions in a drift tube under an electric field [27] [14]. GC-IMS offers several advantages for food VOC analysis, including high sensitivity (parts-per-billion to parts-per-trillion range), rapid analysis times, operational at atmospheric pressure, and minimal sample preparation requirements [27]. The technique generates three-dimensional data maps (retention time, drift time, intensity) that provide characteristic fingerprints of food volatile profiles [28].
Electronic Nose (E-Nose) Systems
Electronic noses are bio-inspired instruments that mimic the mammalian olfactory system through arrays of semi-selective chemical sensors combined with pattern recognition algorithms [18] [29]. These systems typically comprise three core components: a sample delivery system, a detection system with multiple sensors of partial specificity, and a computing system for data processing and pattern recognition [18]. When VOCs interact with sensor surfaces, they produce electrical signal changes (resistance, conductivity, frequency) that generate unique response patterns ("fingerprints") for different odor profiles [30] [29]. Common sensor technologies include metal oxide semiconductors (MOS), conducting polymers (CP), quartz crystal microbalances (QCM), and surface acoustic wave (SAW) devices, each with distinct detection mechanisms and sensitivity profiles [18] [25].
Table 1: Comparison of GC-IMS and E-Nose Technologies for Food VOC Analysis
| Parameter | GC-IMS | Electronic Nose |
|---|---|---|
| Detection Principle | Physical separation + ionization mobility | Chemical interaction with sensor arrays |
| Analytical Output | Compound identification and quantification | Composite fingerprint or pattern |
| Sensitivity | High (ppb-ppt range) | Moderate to high (ppm-ppb range) [30] |
| Analysis Time | 10-30 minutes | 1-5 minutes [18] |
| Compound Identification | Specific compound identification | Class-based identification without specific compound data |
| Sample Throughput | Moderate | High |
| Portability | Benchtop systems, limited portability | Portable and handheld options available |
| Data Complexity | High (3D data: retention time, drift time, intensity) | Moderate (multidimensional sensor responses) |
| Cost | High equipment cost | Lower to moderate cost [25] |
Common VOC Classes in Food Products
Food VOCs originate from various biochemical pathways, including lipid oxidation, Maillard reactions, enzymatic activity, microbial metabolism, and environmental contamination [26]. The composition and concentration of these volatile compounds directly influence sensory attributes and serve as indicators of freshness, spoilage, and authenticity.
Table 2: Major VOC Classes in Food with Representative Compounds and Origins
| VOC Class | Representative Compounds | Food Sources | Sensory Attributes |
|---|---|---|---|
| Aldehydes | Hexanal, Heptanal, Nonanal, (E)-2-decenal | Fish, meat, edible oils [28] [31] | Green, grassy, fatty, pungent |
| Alcohols | 1-Pentanol, 1-Octen-3-ol, 2-Methyl-1-propanol | Fermented foods, fish, sesame oil [28] [31] | Mushroom, earthy, fermented |
| Ketones | Acetone, 2-Butanone, 2-Heptanone, Acetoin | Dairy products, fermented foods [26] | Buttery, fruity, sweet |
| Esters | Ethyl acetate, Ethyl butanoate | Fruits, fermented beverages | Fruity, sweet |
| Sulfur Compounds | Dimethyl disulfide, Dimethyl trisulfide | Decomposition, Allium species [30] [26] | Rotten, cabbage-like, pungent |
| Terpenes | Limonene, γ-Terpinene | Citrus, herbs, spices [14] [31] | Citrus, herbal, pine |
| Furans | 2-Pentylfuran | Heated foods, roasted products | Earthy, beany, caramel-like |
| Pyrazines | 2,3-Dimethylpyrazine, Tetramethylpyrazine | Roasted nuts, coffee, meat | Roasted, nutty, earthy |
Microbial Volatile Organic Compounds (mVOCs)
Microbial metabolic activity produces characteristic VOC profiles that serve as early indicators of food spoilage and contamination. The primary biochemical pathways for mVOC generation include carbohydrate fermentation (producing alcohols, esters, carbonyl compounds), amino acid catabolism (generating ammonia, sulfides, amines), and lipid degradation (producing aldehydes, ketones, fatty acids) [26]. Specific mVOC patterns correlate with microbial taxa; for instance, Pseudomonas species typically produce sulfur compounds like dimethyl sulfide, while Lactobacillus species generate diacetyl and acetoin [26]. During microbial growth progression, alcohol compounds often dominate early stages, while sulfur compounds and short-chain fatty acids increase in later spoilage phases, contributing to offensive odors [26].
Experimental Protocols for VOC Analysis
Sample Preparation and Headspace Sampling
Proper sample preparation is critical for reproducible VOC analysis. For solid and semi-solid food matrices, homogenization increases surface area and promotes volatile release. Typical sample sizes range from 1-5 grams, weighed into specialized headspace vials (10-40 mL capacity) [28] [31]. Headspace sampling techniques include:
- Static Headspace: Samples are equilibrated at controlled temperatures (typically 40-80°C) for 15-50 minutes to allow volatile partitioning into the gas phase [28] [31].
- Solid-Phase Microextraction (SPME): A fused silica fiber coated with absorbing material (e.g., DVB/CAR/PDMS) is exposed to the sample headspace to concentrate volatiles, then thermally desorbed in the instrument injection port [14] [28].
- Purge-and-Trap: Inert gas purges volatiles from the sample, which are then trapped on an adsorbent material for subsequent thermal desorption [26].
Figure 1: Experimental workflow for food VOC analysis using GC-IMS and e-nose technologies
GC-IMS Analysis Parameters
Standard GC-IMS operating conditions for food VOC analysis include:
- Sample Injection: 100-500 μL of headspace gas in splitless mode at 80-85°C [28] [31]
- Chromatographic Separation: Capillary column (e.g., MXT-5, FS-SE-54-CB-1, 15-30 m length) with temperature programming from 40°C to 240°C [28] [31]
- Carrier Gas: Nitrogen (99.999% purity) with programmed flow rates (2-150 mL/min) [14] [28]
- Ionization Source: Tritium (³H) or β-radiation source [31]
- Drift Tube: Temperature 45°C, electric field strength 500 V/cm, drift gas (N₂) flow 150 mL/min [28] [31]
- Analysis Duration: 20-50 minutes per sample [28] [31]
Electronic Nose Operation Protocols
Standard e-nose parameters for food analysis include:
- Sample Equilibration: 15-50 minutes at 20-80°C [28] [31]
- Measurement Time: 60-120 seconds with sensor response recorded at stable intervals [28] [32]
- Sensor Cleaning: 60-120 seconds with clean air between measurements to prevent cross-contamination [28]
- Data Acquisition: Recording of steady-state sensor responses or full time-series data [18] [29]
Comparative Performance in Food Applications
Food Quality and Freshness Assessment
Both GC-IMS and e-nose technologies effectively monitor food quality changes during storage. In fish analysis, GC-IMS detected 72 volatile compounds in cooked golden pomfret, with aldehydes (hexanal, (E)-2-dodecenal), alcohols, and ketones serving as freshness indicators [28]. E-nose systems have successfully discriminated fresh and spoiled meat products with >90% accuracy using pattern recognition algorithms [18]. A comparative study demonstrated that GC-IMS provided more detailed compound-specific information, while e-nose offered faster classification (minutes vs. 30 minutes) for spoilage detection [14].
Authentication and Adulteration Detection
Food authentication represents a prominent application for both technologies. In essential oil analysis, GC-IMS and e-nose successfully differentiated star anise essential oils extracted via different methods (hydrodistillation, ethanol solvent extraction, supercritical CO₂, subcritical extraction) [14]. Similarly, both techniques discriminated sesame oils processed by water substitution, cold-pressing, and hot-pressing methods based on distinct VOC profiles [31]. GC-IMS identified 60 specific VOCs across the sesame oil samples, while e-nose provided rapid classification without compound identification [31].
Processing and Fermentation Monitoring
VOC profiling effectively tracks biochemical changes during food processing. In fermented products, alcohol and ester compounds dominate successful fermentations, while sulfur compounds and short-chain fatty acids indicate spoilage or off-flavors [26]. E-nose systems demonstrate particular utility for real-time fermentation monitoring due to rapid analysis capabilities, while GC-IMS provides detailed metabolic pathway insights through specific compound identification [26].
Table 3: Method Selection Guide for Food VOC Analysis Applications
| Application Scenario | Recommended Technology | Rationale | Typical Analysis Time |
|---|---|---|---|
| Routine Quality Control | Electronic Nose | High throughput, minimal training, cost-effective [18] | 1-5 minutes |
| Spoilage Pathway Investigation | GC-IMS | Detailed compound identification, metabolic insights [26] | 20-40 minutes |
| Process Optimization | GC-IMS + E-nose | Complementary data: mechanism + rapid monitoring | 25-45 minutes |
| Field Testing | Portable E-nose | Battery operation, portability, rapid results [25] | 1-3 minutes |
| Regulatory Compliance | GC-IMS | Definitive compound identification, quantitative data | 30-50 minutes |
| Authentication | Either (application-dependent) | E-nose for screening, GC-IMS for confirmation [14] | 2-40 minutes |
The Scientist's Toolkit: Essential Research Reagents and Materials
Table 4: Essential Research Materials for Food VOC Analysis
| Item | Function | Application Examples |
|---|---|---|
| SPME Fibers (DVB/CAR/PDMS) | Volatile compound extraction and concentration | Headspace sampling for GC-MS and GC-IMS [14] [28] |
| Internal Standards (2,4,6-Trimethylpyridine) | Quantification reference and retention time calibration | GC-MS and GC-IMS method validation [28] |
| n-Alkane Standards (C5-C32) | Retention index calibration for compound identification | GC-IMS and GC-MS database development [28] [31] |
| Headspace Vials (10-40 mL) | Controlled sample environment for volatile equilibrium | All headspace-based VOC analysis [28] [31] |
| Inert Gas Supply (N₂, 99.999%) | Carrier and drift gas for GC-IMS | Maintaining analytical system integrity [14] [28] |
| Sensor Array Modules (MOS, CP, QCM) | VOC detection and pattern generation | E-nose system operation [18] [29] |
| Ketone Standards (C4-C9) | IMS drift time calibration | GC-IMS system calibration [31] |
Figure 2: Decision framework for selecting appropriate VOC analysis technology
GC-IMS and electronic nose technologies offer complementary approaches for VOC analysis in food quality assessment. GC-IMS provides superior compound identification capabilities and detailed metabolic insights, making it ideal for research applications requiring mechanistic understanding [14] [26]. Electronic nose systems excel in rapid screening, quality classification, and process monitoring applications where speed and cost-effectiveness are priorities [18] [25]. The selection between these technologies should be guided by specific research objectives, with GC-IMS preferred for compound-specific investigation and e-nose advantageous for high-throughput quality screening. Future developments in sensor technologies, miniaturization, and artificial intelligence-enhanced pattern recognition will further expand applications of both techniques in food quality and safety assessment [29] [25].
From Theory to Practice: Methodological Protocols and Real-World Food Applications
Standardized Sample Preparation Methods for Oils, Solids, and Liquids
The accuracy of food quality assessment, particularly when comparing advanced analytical techniques like Gas Chromatography-Ion Mobility Spectrometry (GC-IMS) and Electronic Nose (E-nose), is fundamentally dependent on robust and standardized sample preparation. Sample preparation is the most essential and time-consuming stage of the entire analytical process, with the greatest impact on the reliability and reproducibility of results [33]. The core objectives of this stage include concentrating target analytes, changing the sample matrix, and removing interferents to ensure that the subsequent analysis accurately reflects the sample's true properties [33]. Without standardized protocols, the comparative performance data of instruments like GC-IMS and E-nose can be misleading, as variations in sample preparation can introduce significant artifacts or mask true compositional differences.
The choice between GC-IMS and E-nose often involves a trade-off between analytical depth and speed. GC-IMS provides detailed, separable volatile organic compound (VOC) profiles with high sensitivity, whereas E-nose offers rapid, high-level aroma fingerprinting. For both technologies, the sample preparation method must be tailored to the sample's physical state—oils, solids, or liquids—and the specific analytical question, whether it is geographical traceability, authenticity verification, or quality control [34] [35]. This guide objectively compares standardized preparation methods for different sample matrices, providing experimental data and protocols to inform researchers in selecting the optimal workflow for their food quality assessment research.
Table 1 summarizes the core characteristics of GC-IMS and E-nose technologies, highlighting their respective advantages, limitations, and ideal use cases in food analysis. This comparison provides a foundation for understanding how sample preparation needs differ between the two techniques.
Table 1: Comparative Overview of GC-IMS and E-Nose for Food Quality Assessment
| Feature | GC-IMS | Electronic Nose (E-nose) |
|---|---|---|
| Analytical Principle | Separation by GC followed by drift time in IMS [14] [34] | Sensor array response to volatile compounds [2] [17] |
| Key Output | Detailed 2D/3D spectral fingerprints of individual VOCs [34] | Composite aroma signature or fingerprint [17] |
| Sensitivity | High (ppb to ppt levels) [14] | Moderate to High [2] |
| Analysis Speed | Medium (minutes to tens of minutes) [14] | Rapid (seconds to minutes) [2] [17] |
| Selectivity | High, capable of separating isomeric compounds [14] | Lower, pattern-based recognition [17] |
| Data Complexity | High; requires specific software for interpretation [34] | Lower; relies on pattern recognition algorithms [2] |
| Ideal Application | Identifying and quantifying specific VOCs for authenticity or origin [34] [35] | Rapid classification, grading, and on-line process monitoring [2] [17] |
| Sample Preparation Need | Often requires headspace pre-concentration (e.g., SPME) [34] | Typically minimal; direct headspace analysis is common [14] |
Standardized Sample Preparation Methods by Matrix
Liquid Samples: Raw Milk
Liquid samples like raw milk are often analyzed for geographical origin traceability. A comparative study using E-nose, E-tongue, GC-IMS, and HS-SPME/GC-MS demonstrated that intelligent sensory technology (E-nose/E-tongue) could effectively distinguish samples from Southern and Northern China, with chromatography methods providing confirmatory VOC identification [34].
- E-Nose Protocol: For raw milk analysis, transfer 2 mL of sample into a 40 mL headspace injection vial. Allow the sample to equilibrate at 20°C for 50 minutes before automated headspace sampling. The typical measurement time is 100 seconds, with data acquisition from a 10-sensor array [34].
- GC-IMS Protocol: For the same milk samples, inject 100 μL of sample into the HS-GC-IMS system. The sample is incubated at 85°C for 5 minutes before being injected in splitless mode. Separation is performed using an FS-SE-54-CB-1 column (15 m × 0.53 mm) at 40°C [34].
- HS-SPME/GC-MS Protocol: For GC-MS analysis, use a 65 μm PDMS/DVB SPME fiber for headspace extraction. The sample is incubated at 70°C for 1.5 hours to allow for VOC absorption onto the fiber, which is then desorbed in the GC injector port [34].
Solid Samples: Fermented Douchi
Solid fermented products like Douchi require specific preparation to release and analyze volatile aroma compounds. An integrated analysis using E-nose, GC-IMS, and GC-MS successfully monitored the impact of aroma-enhancing microorganisms on its flavor profile [35].
- Sample Homogenization: The solid Douchi sample must be first homogenized into a consistent paste to ensure a representative analysis and a uniform headspace [35].
- E-Nose & GC-IMS Protocol: Weigh 2.0 g of the homogenized Douchi into a 20 mL headspace vial. For E-nose analysis, the equilibrium time and temperature must be rigorously controlled. For GC-IMS, the sample is typically incubated at 60°C for 15 minutes before headspace injection [35].
- HS-SPME/GC-MS Protocol: For concurrent GC-MS analysis, place 3.0 g of sample into a 20 mL vial. The HS-SPME extraction is carried out at 60°C for 30 minutes using a suitable fiber (e.g., 50/30 μm DVB/CAR/PDMS) [35].
Oily Samples: Olive Oil
The analysis of olive oil presents a significant challenge due to its high organic load and viscosity, which can lead to matrix effects and instrumental issues. A study comparing preparation methods for ICP-MS analysis of olive oil found that liquid-liquid extraction outperformed microwave digestion for multielement analysis [36].
- Ultrasound-Assisted Liquid-Liquid Extraction (Recommended): Accurately weigh 0.5 g of olive oil into a digestion tube. Add 5 mL of a 2% (v/v) nitric acid solution. Subject the mixture to ultrasonication for 10 minutes to emulsify and extract inorganic elements. Centrifuge the mixture to separate the aqueous layer for analysis. This method provides superior detection limits (as low as 0.00061 µg·kg⁻¹ for some elements) and better precision compared to digestion methods [36].
- Microwave-Assisted Acid Digestion: Weigh 0.2 g of olive oil into a digestion vessel. Add 5 mL of concentrated HNO₃ and 2 mL of H₂O₂. Carry out microwave digestion using a ramped temperature program (e.g., to 200°C). After digestion, dilute the sample to 25 mL with ultrapure water. This method, while common, can result in higher detection limits and poorer precision due to the need for significant dilution [36].
The workflow for selecting and applying these methods is summarized in the following diagram:
Essential Research Reagent Solutions
Table 2 lists key reagents, sorbents, and materials commonly used in sample preparation for food quality analysis, along with their specific functions in the analytical workflow.
Table 2: Key Research Reagents and Materials for Sample Preparation
| Reagent/Material | Function/Application | Example Use Case |
|---|---|---|
| SPME Fibers (e.g., PDMS/DVB, DVB/CAR/PDMS) | Pre-concentration of VOCs from sample headspace [14] [35] | Extraction of volatiles from Douchi or milk prior to GC-MS [34] [35] |
| Metal-Organic Frameworks (MOFs) | High-surface-area sorbents for solid-phase extraction; tunable pore size for selectivity [33] | Used in SPE, SPME, and MSPE for isolating analytes from complex liquid samples [33] |
| Enhanced Matrix Removal (EMR) Cartridges | Pass-through cleanup cartridges for removing specific matrix interferences (e.g., lipids) [37] | Lipid removal from fatty food samples like meat and fish prior to contaminant analysis [37] |
| Deep Eutectic Solvents (DES) | Green, biodegradable solvents for extraction, replacing traditional toxic organic solvents [38] [39] | Sustainable extraction of bioactive compounds or pollutants from food matrices [38] |
| Graphitized Carbon Black (GCB) | SPE sorbent effective at removing pigment and other planar molecules from extracts [37] | Cleanup in pesticide residue analysis (e.g., in EPA Method 8081) [37] |
| Weak Anion Exchange (WAX) Sorbents | SPE sorbent for extracting acidic compounds, such as PFAS, from environmental and food samples [37] | Extraction and cleanup of PFAS from aqueous and solid samples per EPA Method 1633 [37] |
The selection of a standardized sample preparation method is a critical determinant in the successful application of GC-IMS and E-nose technologies for food quality assessment. As demonstrated, the optimal protocol is highly dependent on the sample matrix: direct headspace analysis after equilibration suffices for many liquid and solid samples analyzed by E-nose or GC-IMS, while oily matrices often require more extensive extraction and cleanup, such as ultrasound-assisted liquid-liquid extraction, to mitigate complex matrix effects.
The ongoing development of green chemistry principles and new sorbent materials like MOFs and EMR cartridges is continuously refining these preparation workflows, making them more efficient, sustainable, and selective [33] [38] [39]. For researchers, the decision between using GC-IMS for detailed VOC profiling or E-nose for rapid fingerprinting should be made in concert with the appropriate sample preparation strategy outlined in this guide. This integrated approach ensures generated data is both analytically robust and fit-for-purpose, whether for fundamental research, authenticity verification, or industrial quality control.
The quality and authenticity of food products are paramount concerns in the food industry, driving the need for sophisticated analytical techniques to assess and monitor food quality. This case study focuses on the application of two advanced technologies—Gas Chromatography-Ion Mobility Spectrometry (GC-IMS) and electronic nose (e-nose)—for profiling volatile organic compounds (VOCs) in sesame oil produced via different processing methods. Sesame oil is a commodity of high economic and nutritional value, prized for its unique flavor and health-promoting properties, including antioxidant, anti-inflammatory, and hypoglycemic effects [31] [40]. The distinct aroma profile of sesame oil, determined by its VOC composition, is significantly influenced by extraction and processing techniques, making it an ideal subject for comparative analysis of these analytical platforms within food quality assessment research.
Sesame Oil Processing Methods and Their Impact on Flavor
The processing method employed in sesame oil extraction profoundly influences its chemical composition, stability, and sensory characteristics. Different techniques yield oils with distinct flavor profiles and VOC fingerprints, which can be characterized using modern analytical tools.
Water Substitution Method: This traditional technique involves grinding roasted sesame seeds, adding hot water, and stirring to separate oil from the hydrophilic components. The oil is then collected after refrigeration and centrifugation [31]. This method produces sesame oil with a unique, rich, and mellow flavor that is highly prized by consumers, though it results in lower yields compared to other methods [31].
Cold-Pressing Method: This mechanical method involves pressing sesame seeds at controlled low temperatures (40–60°C) under high pressure [31]. The minimal heat exposure helps preserve the oil's natural flavor by preventing the volatilization and deterioration of aromatic compounds and minimizes the oxidation of unsaturated fatty acids [31] [41]. The resulting oil retains a more original, fruity flavor profile.
Hot-Pressing Method: This approach also utilizes mechanical pressing but at significantly higher temperatures (approximately 130°C), often after frying the seeds [31]. The elevated temperature facilitates greater oil extraction by disrupting cellular structures and increasing membrane permeability. However, it may promote oxidation and polymerization reactions that alter the oil's flavor and result in the loss of certain VOCs [31]. The resulting oil typically has a more pronounced fat aroma.
Alternative Methods: Other extraction methods include solvent extraction using hexane, which offers high efficiency but risks chemical residues and potential quality degradation [41], and supercritical CO2 extraction, which is environmentally friendly and preserves oil quality but requires expensive equipment [41].
Table 1: Comparison of Sesame Oil Processing Methods
| Processing Method | Temperature Conditions | Key Flavor Characteristics | Yield Considerations |
|---|---|---|---|
| Water Substitution | ~100°C (water heating) | Unique, rich, mellow flavor | Lower yield |
| Cold-Pressing | 40-60°C | Original, fruity flavor | Moderate yield |
| Hot-Pressing | ~130°C (including frying) | Pronounced fat aroma | Higher yield |
| Solvent Extraction | Varies | Dependent on refining process | Highest yield |
Analytical Platforms for VOC Profiling
GC-IMS Technology
Gas Chromatography-Ion Mobility Spectrometry (GC-IMS) is a powerful analytical technique that combines the separation power of gas chromatography with the detection sensitivity of ion mobility spectrometry. The technology operates by first separating volatile compounds in the GC column, then ionizing them (typically with a tritium source) and measuring their drift time through a neutral gas under an electric field [31]. This drift time is characteristic of each compound and allows for identification when compared against reference standards.
GC-IMS offers several advantages for food quality assessment, including high sensitivity, rapid analysis, real-time detection capabilities, and wide application range [31]. The technique is particularly valuable for creating detailed VOC fingerprints of complex food aromas without requiring extensive sample preparation. In sesame oil analysis, GC-IMS can detect subtle differences in VOC profiles resulting from variations in processing methods, storage conditions, or potential adulteration [42].
Electronic Nose Technology
The electronic nose (e-nose) is a bio-inspired sensing system designed to mimic human olfaction using an array of chemical gas sensors [43] [19]. These sensors, which may include metal oxide semiconductors (MOS), conducting polymers, quartz crystal microbalances (QCM), or surface acoustic wave (SAW) sensors, interact with odor molecules and generate characteristic response patterns [43] [19]. The resulting signals are processed using pattern recognition systems and machine learning algorithms to classify and identify complex odors.
Modern e-nose systems offer numerous benefits for food quality assessment, including non-destructive analysis, rapid detection capabilities, objectivity, and the ability to provide real-time results [43] [19]. The Heracles NEO ultra-fast gas-phase electronic nose used in recent sesame oil studies incorporates multiple chromatography columns for enhanced separation and detection of VOCs [31]. When integrated with machine learning algorithms, e-nose systems can effectively discriminate between different food quality parameters, including freshness, spoilage, and authenticity [43] [44].
Table 2: Comparison of Analytical Platforms for Sesame Oil VOC Analysis
| Feature | GC-IMS | Electronic Nose |
|---|---|---|
| Principle | GC separation + ion mobility detection | Chemical sensor array + pattern recognition |
| Sensitivity | High (ppm-ppb range) | Moderate to high |
| Analysis Speed | Minutes to tens of minutes | Seconds to minutes |
| Data Output | Compound identification and quantification | Fingerprint patterns and classification |
| Sample Preparation | Minimal (headspace sampling) | Minimal (headspace sampling) |
| Key Applications | Detailed VOC profiling, marker identification | Quality grading, adulteration detection, process monitoring |
Experimental Design and Protocols
Sample Preparation Methodology
The comparative study of sesame oil VOCs under different processing methods utilized consistent sample preparation protocols to ensure analytical reliability [31]:
Raw Material Standardization: Sesame seeds from Chaoyang, Liaoning province, China, with a moisture content of 6%, were used as the starting material for all processing methods to eliminate raw material variability.
Water Substitution Method (SS-01): 200g of sesame seeds were fried at 120°C until brown, ground with a stone mill, mixed with hot water (100°C) in a 1:1 ratio (w/v), stirred at 350 rpm for 30 minutes, shaken for 4 hours using a constant temperature oscillator, refrigerated at 4°C for 24 hours, and finally centrifuged at 6,000 rpm for 5 minutes.
Cold-Pressing Method (SS-02): 200g of sesame seeds were pressed in a press oil machine in cold-pressed mode (pressure up to 1,600 kN, 40-60°C), followed by centrifugal filtration at 6,000 rpm for 5 minutes.
Hot-Pressing Method (SS-03): 200g of sesame seeds were processed in a press oil machine in hot-pressing mode (frying for 20 minutes, pressure up to 1,600 kN, approximately 130°C), followed by centrifugal filtration at 6,000 rpm for 5 minutes.
Instrumental Analysis Parameters
GC-IMS Analysis was performed using a FlavorSpec instrument (G.A.S., Dortmund, Germany) with the following parameters [31]:
- Column: MXT-wax capillary column (15 m × 0.53 mm, 1.0 μm)
- IMS conditions: Tritium ionization source; drift tube temperature: 45°C; electric field strength: 500 V/cm; drift gas: N₂ (purity ≥99.999%) at 150 mL/min
- Sample incubation: 1 mL sesame oil in 20 mL headspace vial heated at 80°C for 15 minutes
- Injection: 200 μL in non-shunt mode with a 50-minute run time
Electronic Nose Analysis utilized a Heracles NEO ultra-fast gas-phase e-nose (Alpha MOS, France) with these parameters [31]:
- Columns: MXT-5 (non-polar) and MXT-1701 (medium polar)
- Sample amount: 5 g sesame oil incubated at 80°C for 20 minutes
- Injection: 5,000 μL at 250 μL/s injection speed
- Temperature program: Initial 40°C, rising to 240°C
Data Analysis and Chemometrics
Both technologies generated complex data outputs requiring multivariate analysis for interpretation [31] [44] [42]:
- Principal Component Analysis (PCA) for unsupervised pattern recognition and sample clustering
- Linear Discriminant Analysis (LDA) for supervised classification
- Orthogonal Partial Least Squares-Discriminant Analysis (OPLS-DA) for feature selection and model building
- Machine learning algorithms including Support Vector Machines (SVM) and Artificial Neural Networks (ANN) for predictive modeling
Results and Discussion
VOC Profiles Across Processing Methods
The combined GC-IMS and e-nose analysis detected a total of 74 VOCs across the three sesame oil sample types, providing a comprehensive volatile profile for each processing method [31] [40]. The specific VOC distributions revealed distinctive chemical fingerprints for each processing technique.
Table 3: VOC Distribution in Sesame Oils by Processing Method
| Processing Method | Total VOCs Detected | Key Representative Compounds | Flavor Characteristics |
|---|---|---|---|
| Water Substitution | >42 VOCs | Cyclopentanone, 1-Pentanol | Unique, richer flavor |
| Cold-Pressing | 4 VOCs | γ-Terpinene | Original, fruity flavor |
| Hot-Pressing | 29 VOCs | 2-Methyl-1-propanol | Pronounced fat aroma |
The water substitution method yielded the most complex VOC profile with over 42 identified compounds, including cyclopentanone and 1-pentanol, contributing to its unique and rich flavor profile [31] [40]. In contrast, cold-pressed oil contained only 4 VOCs, with γ-terpinene imparting an original fruity flavor characteristic of minimally processed sesame oil [31] [40]. Hot-pressed oil presented an intermediate profile with 29 VOCs, including 2-methyl-1-propanol, associated with its distinctive fat aroma [31] [40].
The significant differences in VOC complexity can be attributed to the thermal conditions during processing. The cold-pressing method preserves the native volatile compounds without generating significant thermal reaction products, while the hot-pressing and water substitution methods (involving roasting stages) promote Maillard reactions, lipid oxidation, and thermal degradation, generating a more diverse array of volatile compounds [31].
Detection of Adulteration and Quality Assessment
Both GC-IMS and e-nose technologies have demonstrated exceptional capability in detecting sesame oil adulteration, a significant concern in food quality control. Research has shown that HS-GC-IMS combined with chemometric analysis can successfully identify counterfeit sesame oils adulterated with sesame essence at concentrations as low as 0.5% (w/w) [42]. Key marker compounds for adulteration include 2-methylbutanoic acid, 2-furfurylthiol, methylpyrazine, methional, and 2,5-dimethylpyrazine [42].
E-nose systems equipped with metal oxide semiconductor sensors and coupled with machine learning algorithms such as Support Vector Machines (sensitivity: 0.987, specificity: 0.977) and Artificial Neural Networks (sensitivity: 0.949, specificity: 0.953) have shown excellent performance in classifying authentic and adulterated sesame oils [44]. These systems can detect the addition of cheaper oils like soybean and corn oil to sesame oil at mixture percentages ranging from 25% to 100% [44].
Comparative Performance of GC-IMS and E-Nose
When evaluating the performance of GC-IMS versus e-nose for sesame oil VOC analysis, each technology demonstrates distinct strengths and applications:
GC-IMS provides superior compound identification capabilities, enabling the detection and tentative identification of specific marker compounds that differentiate processing methods or indicate adulteration [31] [42]. The two-dimensional separation (retention time × drift time) offers enhanced resolution for complex VOC mixtures.
Electronic Nose systems excel in rapid classification and pattern recognition, generating distinctive fingerprint patterns for different sample types without necessarily identifying individual compounds [43] [44]. This makes e-nose particularly suitable for high-throughput quality screening and process monitoring.
The integration of both technologies creates a powerful analytical approach, with GC-IMS providing detailed chemical information for method validation and marker identification, while e-nose offers rapid, non-destructive screening capabilities suitable for industrial quality control environments [31] [19].
The Scientist's Toolkit: Essential Research Reagents and Materials
Table 4: Key Research Reagents and Materials for Sesame Oil VOC Analysis
| Item | Specification/Type | Function/Application |
|---|---|---|
| Sesame Seeds | Standardized moisture content (6%) | Raw material for oil extraction to ensure consistency |
| GC-IMS Instrument | FlavorSpec with MXT-wax column | VOC separation and detection |
| Electronic Nose | Heracles NEO with dual columns | Rapid VOC fingerprinting |
| Headspace Vials | 20 mL with sealed caps | Sample containment and VOC accumulation |
| Calibration Standards | Ketone mix (C5-C9) | Instrument calibration and RI calculation |
| Chromatography Columns | MXT-5 (non-polar), MXT-1701 (medium polar) | Compound separation in e-nose |
| Centrifuge | 6,000 rpm capability | Oil clarification and purification |
| Chemometric Software | PCA, LDA, OPLS-DA, SVM, ANN algorithms | Multivariate data analysis and pattern recognition |
This case study demonstrates the effective application of GC-IMS and electronic nose technologies for profiling VOCs in sesame oil produced via different processing methods. The findings reveal distinct VOC fingerprints characteristic of each processing technique, with water substitution yielding the most complex profile (>42 VOCs), followed by hot-pressing (29 VOCs), and cold-pressing (4 VOCs). Both analytical platforms offer complementary strengths: GC-IMS provides detailed compound identification crucial for method development and marker validation, while e-nose systems deliver rapid, non-destructive analysis ideal for quality control and adulteration detection in industrial settings.
The integration of these technologies with advanced chemometric methods creates a powerful framework for food quality assessment that balances analytical depth with operational efficiency. As these technologies continue to evolve, particularly with advancements in sensor technology, miniaturization, and artificial intelligence, their implementation in food quality monitoring systems is poised to expand, offering more accessible, robust, and comprehensive solutions for ensuring food authenticity, safety, and quality throughout the production and distribution chain.
Fermented foods like Douchi (a traditional Chinese fermented soybean product) and various dairy products such as cheese and kefir present a complex analytical challenge for food scientists. Their distinctive aroma profiles, crucial for consumer acceptance and product quality, comprise hundreds of volatile organic compounds (VOCs) generated through microbial metabolism during fermentation [45] [46]. Monitoring these dynamic aromatic changes requires analytical techniques that are not only accurate but also efficient. In recent years, Gas Chromatography-Ion Mobility Spectrometry (GC-IMS) and Electronic Nose (E-Nose) technologies have emerged as powerful tools for this purpose, each offering distinct advantages and limitations [14] [28]. This guide provides an objective comparison of their performance based on experimental data, framed within the context of food quality assessment research.
GC-IMS combines the high separation capability of gas chromatography with the rapid detection of ion mobility spectrometry, providing a detailed, two-dimensional fingerprint of volatile compounds [14] [28]. In contrast, the E-Nose employs an array of non-specific chemical sensors coupled with pattern recognition systems to rapidly provide holistic aroma information, mimicking the human sense of smell [35] [47]. Understanding the strengths and limitations of each technology is essential for researchers to select the optimal tool for specific applications in fermentation monitoring and aroma enhancement.
Technology Comparison: GC-IMS vs. Electronic Nose
The following table provides a structured comparison of the core technical characteristics of GC-IMS and E-Nose systems, summarizing their fundamental principles and performance metrics.
Table 1: Fundamental characteristics and performance comparison of GC-IMS and E-Nose
| Feature | GC-IMS | Electronic Nose (E-Nose) |
|---|---|---|
| Basic Principle | Separation via GC followed by drift-time-based detection using IMS [14] [28] | Array of non-specific sensors with pattern recognition [35] [47] |
| Analysis Type | Detailed separation and identification of individual volatile compounds [28] | Holistic, non-destructive fingerprint of the overall sample aroma [14] [48] |
| Sample Introduction | Headspace injection (typically 100-500 μL) [14] | Headspace sampling via pump [14] |
| Detection Limit | Low ppb to ppt range (high sensitivity) [14] | Varies by sensor; generally less sensitive than GC-IMS [14] |
| Analysis Speed | 10-30 minutes per sample [14] | A few minutes per sample (rapid) [14] |
| Primary Output | 2D or 3D topographic plots (Retention Time vs. Drift Time vs. Intensity) and fingerprint spectra [14] [28] | Multi-dimensional response pattern from sensor array (radar plots) [14] [28] |
| Data Analysis | Complex, requires specific software (LAV, GC-IMS Library Suite); PCA, PLS-DA [14] | PCA, LDA, and other multivariate statistical analyses [35] [14] |
| Compound Identification | Yes, via comparison with internal databases and standards [28] | No direct identification; classification and discrimination based on patterns [47] [28] |
The performance of these two techniques can be further evaluated based on key operational parameters relevant to industrial and research settings. The next table contrasts their capabilities in critical areas such as sensitivity, sample preparation needs, and cost.
Table 2: Performance and operational capability comparison for food quality assessment
| Performance Metric | GC-IMS | Electronic Nose (E-Nose) |
|---|---|---|
| Sensitivity | High sensitivity, capable of detecting trace-level volatiles [14] | Moderate sensitivity, suitable for dominant aroma profiles [14] |
| Selectivity | High, due to two-dimensional separation (GC retention + IMS drift time) [14] | Low to moderate, based on cross-reactive sensor array [47] |
| Repeatability | High (Retention Index < 100 and Drift Time Index < 0.5 ms) [14] | Good, but sensors can drift over time, requiring recalibration [47] |
| Sample Preparation | Minimal; often requires only headspace equilibration [14] [49] | Minimal; non-destructive headspace analysis [14] [48] |
| Throughput | Medium (slower than E-Nose due to chromatographic run time) [14] | High (rapid analysis enables real-time or near-real-time monitoring) [14] [50] |
| Ease of Use | Requires trained personnel for operation and data interpretation [28] | Generally user-friendly, with automated pattern recognition [47] |
| Cost of Ownership | High initial investment and maintenance [47] | Lower initial investment and maintenance costs [47] |
Case Study: Aroma Enhancement in Industrial Douchi
Experimental Background and Protocol
Objective: To assess the impact of exogenous aroma-enhancing microorganisms (Geotrichum candidum and Candida versatilis) on the volatile profile and sensory attributes of industrial Douchi, and to compare the efficacy of E-Nose, GC-IMS, and GC-MS in monitoring these changes [35].
Materials:
- Samples: Industrial Douchi samples, including a control group (CK) and treatment groups inoculated with different ratios of G. candidum and C. versatilis (e.g., 1:1, referred to as the GCC group) [35].
- Instrumentation: PEN3 E-Nose system, GC-IMS instrument (FlavourSpec, G.A.S.), and GC-MS system [35].
Methodology:
- E-Nose Analysis: A total of 2g of Douchi sample was placed in a 40 mL headspace vial and equilibrated at 40°C for 30 minutes. The PEN3 E-Nose measured the headspace for 100s, with a flush time of 80s to clean sensors between samples. Data from the 10 metal oxide sensors were analyzed using Principal Component Analysis (PCA) and Linear Discriminant Analysis (LDA) [35].
- GC-IMS Analysis: A separate aliquot of the sample headspace (500 μL) was injected automatically into the GC-IMS in splitless mode. Separation was performed on a FS-SE-54-CB-1 column (15 m length) at 40°C with a programmed nitrogen carrier gas flow. Volatile compounds were ionized and detected in the IMS drift tube at 45°C. Data were visualized as topographic plots and fingerprints using LAV software [35].
- Sensory Analysis: A trained descriptive sensory panel evaluated the samples to quantify attributes like sourness, wine-like, and sweet aromas, providing ground-truth data for instrumental results [35].
- Statistical Analysis: Partial Least Squares-Discriminant Analysis (PLS-DA) was applied to the GC-IMS and GC-MS data to identify significant differential metabolites responsible for sample discrimination [35].
Results and Comparative Performance
- E-Nose Findings: The E-Nose effectively discriminated between the control and treatment groups. The GCC group showed significantly different response values for sensors W5S (sensitive to nitrogen oxides), W1W (sulfides), and W2W (organic sulfides) compared to CK, indicating a fundamental shift in the overall volatile profile [35]. PCA and LDA of E-Nose data confirmed clear separation between sample groups.
- GC-IMS Findings: GC-IMS detected a wide range of volatile compounds and revealed significant changes in the Douchi's volatile composition following bioenhancement. PLS-DA of GC-IMS data identified 17 differential metabolites, including key compounds like benzaldehyde, benzene acetaldehyde, 3-octanone, and ethyl 2-methylbutyrate [35]. The technique visually demonstrated a reduction in acid and aldehyde compounds and an increase in alcohols and esters in the GCC group.
- Sensory Correlation: The instrumental findings were confirmed by sensory evaluation. The GCC group exhibited a significant reduction in sourness (p < 0.001) and a notable enhancement in wine-like and sweet aromas (p < 0.05) [35]. The synergy of E-Nose, GC-IMS, and sensory data confirmed that the aroma profile was optimally enhanced with a 1:1 ratio of the two microorganisms.
The workflow below illustrates the integrated experimental approach for analyzing aroma profiles in Douchi.
Case Study: Flavor Optimization in Dairy Fermentation
Experimental Background and Protocol
Objective: To characterize the volatile and odor-active compounds in traditionally fermented dairy products (using Mabisi, a Zambian fermented milk, as an archetype) and to understand the link between microbial communities and aroma development [46].
Materials:
- Samples: Four variants of Mabisi (backslopping, barotse, illa, and tonga) produced using different traditional methods, leading to variations in the microbial ecosystem [46].
- Instrumentation: Gas Chromatography-Olfactometry-Mass Spectrometry (GC-O-MS), Proton Transfer Reaction-Quadrupole interface Time-of-Flight Mass Spectrometry (PTR-QiTOF-MS). 16S rRNA amplicon sequencing for microbial community analysis [46].
Methodology:
- GC-O-MS Analysis: Volatile compounds were extracted from samples using headspace solid-phase microextraction (HS-SPME) and separated by GC. The effluent was split between a mass spectrometer for compound identification and an olfactory port where trained human assessors sniffed and described the odor-active compounds in real-time. This allowed for the direct association of specific chemical compounds with sensory perception [46].
- PTR-QiTOF-MS Analysis: This complementary technique was used for the real-time, high-sensitivity quantification of volatile compounds without prior chromatographic separation, providing data on compound concentration [46].
- Microbial Analysis: 16S rRNA amplicon sequencing was performed to characterize the bacterial community composition and diversity in each Mabisi variant [46].
- Data Integration: Data from GC-O-MS, PTR-QiTOF-MS, and microbial sequencing were correlated to establish relationships between the dominant microbiota (e.g., Lactococcus species) and the formation of key aroma compounds [46].
Results and Comparative Insights
- Identification of Key Aromas: GC-O-MS identified 12 key odor-active compounds, primarily ketones (imparting buttery notes) and esters (imparting fruity notes), that were most relevant to the sensory perception of Mabisi, despite the presence of hundreds of volatiles [46].
- Microbial-Aroma Correlation: The study found that while the VOC profiles showed significant variation across the four Mabisi variants, the microbial composition (dominated by Lactococcus species) showed only minor differences. This highlights the powerful influence of specific microbial metabolic activities and production methods on the final aroma profile, even within similar microbial communities [46].
- Concentration vs. Odor Activity: A critical finding was that a high concentration of a volatile compound does not necessarily correlate with its sensory impact. This underscores the superior value of GC-O-MS over non-olfactometry-based techniques for pinpointing the compounds that truly drive aroma [46].
The following diagram summarizes the multi-technique approach to linking microbial ecology with aroma development in fermented dairy products.
The Scientist's Toolkit: Essential Research Reagents and Materials
Successful execution of fermentation monitoring and aroma analysis requires a suite of specialized reagents and materials. The following table details key solutions and their applications in the featured experiments.
Table 3: Key research reagent solutions for fermentation and aroma analysis
| Research Reagent / Material | Function and Application in Analysis |
|---|---|
| Headspace SPME Fibers (e.g., 50/30 μm DVB/CAR/PDMS) | Adsorbs and concentrates volatile compounds from the sample headspace for injection into GC-IMS or GC-MS, enabling high-sensitivity analysis [35] [49]. |
| Chemical Standards for Calibration (e.g., Anethole, Limonene, Benzaldehyde) | Used for quantitative analysis and for calculating Linear Retention Indices (LRI) to aid in the accurate identification of unknown volatile compounds [14] [49]. |
| Internal Standards (e.g., 2,4,6-Trimethylpyridine, 2-Methyl-3-heptanone) | Added in a known concentration to the sample to correct for analytical variability, improving the accuracy and precision of quantitative measurements in GC-MS and GC-IMS [49] [28]. |
| Culture Media (e.g., PDA, MRS Broth) | For the cultivation and maintenance of aroma-enhancing microorganisms (e.g., G. candidum, S. cerevisiae, Lactobacillus spp.) used in controlled fermentation studies [35] [48]. |
| n-Alkane Standard Solutions (C5–C32) | Injected to establish a retention index scale for GC separation, which is crucial for comparing and identifying compounds across different analytical systems and laboratories [14] [46]. |
This comparative analysis demonstrates that GC-IMS and E-Nose are highly complementary technologies for fermentation monitoring and aroma assessment. The E-Nose excels in rapid, high-throughput discrimination between sample groups, making it ideal for quality control, spoilage detection, and monitoring fermentation progress in real-time [14] [28]. In contrast, GC-IMS provides superior compound identification and sensitivity, effectively bridging the gap between the high-level fingerprinting of an E-Nose and the detailed but slower analysis of GC-MS [14]. It is particularly powerful for visualizing complex volatile fingerprints and identifying specific differential metabolites in response to process changes or microbial inoculations [35].
The future of food aroma analysis lies in the integration of multiple techniques. Combining the rapid screening capability of the E-Nose with the detailed separation and identification power of GC-IMS and GC-MS, and further correlating these data with sensory evaluation (GC-O) and microbial ecology (e.g., 16S rRNA sequencing), provides a comprehensive understanding of the factors driving aroma formation [35] [46]. Furthermore, emerging trends point toward the use of artificial intelligence (AI) and machine learning to analyze the complex, multi-dimensional data generated by these instruments, enabling better prediction of sensory outcomes and optimization of fermentation processes [50]. For researchers and industry professionals, the choice between GC-IMS and E-Nose is not a matter of superiority but of strategic application, driven by the specific objectives of the analysis—whether it is for rapid process control or deep, molecular-level product development.
Spoilage Detection and Freshness Evaluation in Meat, Seafood, and Produce
In the field of food quality and safety, the rapid and accurate assessment of spoilage and freshness is paramount for researchers and industry professionals. Among the most advanced techniques for volatile organic compound (VOC) analysis are Gas Chromatography-Ion Mobility Spectrometry (GC-IMS) and electronic nose (E-nose) systems. While both techniques analyze the volatile profile of food samples, they operate on fundamentally different principles, offering complementary strengths and limitations. GC-IMS combines the separation power of gas chromatography with the rapid detection capability of ion mobility spectrometry, providing detailed molecular-level information. In contrast, E-nose systems use an array of semi-selective chemical sensors to generate composite fingerprint patterns of complex odors, mimicking the mammalian olfactory system [31] [51] [18]. This guide provides an objective comparison of these technologies, supported by experimental data from recent studies, to inform selection for specific research applications in meat, seafood, and produce quality assessment.
Technology Comparison: Operational Principles and Performance Characteristics
Fundamental Technological Differences
Electronic Nose (E-nose) systems comprise three core components: a chemical sensor array with broad and overlapping selectivity, a signal processing unit, and a pattern recognition system [51] [18]. When VOC molecules interact with the sensor surfaces, the resulting changes in electrical properties are converted into digital signals. These systems employ various sensor technologies, including metal oxide semiconductors (MOS), conducting polymers (CP), quartz crystal microbalances (QCM), and electrochemical cells [52] [51] [18]. The generated signal patterns are interpreted using multivariate statistical methods such as Principal Component Analysis (PCA) or Artificial Neural Networks (ANN) to classify samples based on their overall odor profile [51].
Gas Chromatography-Ion Mobility Spectrometry (GC-IMS) operates through a two-step process: First, VOCs are separated in the gas chromatographic column based on their partitioning between mobile and stationary phases. Subsequently, separated molecules are ionized and introduced into a drift tube where they migrate under a weak electric field at atmospheric pressure. Their drift time depends on their size, shape, and charge, yielding a two-dimensional fingerprint (retention time vs. drift time) that enables highly sensitive detection and identification of compounds [31] [53].
Table 1: Core Technological Principles and Data Output Characteristics
| Feature | Electronic Nose | GC-IMS |
|---|---|---|
| Principle | Array of semi-selective chemical sensors | Two-dimensional separation (GC + IMS) |
| Data Output | Composite fingerprint pattern | Individual compound identification and quantification |
| Analysis Level | Macroscopic (whole aroma profile) | Molecular (specific compounds) |
| Detection Mechanism | Physical/chemical changes on sensor surfaces | Ion separation in electric field |
| Typical Analysis Time | Minutes | 10-50 minutes |
| Sample Introduction | Direct headspace sampling | Headspace injection with chromatographic separation |
Performance Comparison in Food Quality Applications
Both technologies have demonstrated effectiveness in food quality assessment, though with distinct performance characteristics. E-nose systems typically offer faster analysis times, ranging from a few minutes, making them suitable for high-throughput screening applications [51]. GC-IMS provides more detailed molecular information but requires longer analysis times, typically between 10-50 minutes per sample [31].
In terms of sensitivity, GC-IMS generally offers lower detection limits, capable of identifying compounds at parts-per-billion (ppb) or even parts-per-trillion (ppt) levels [31]. E-nose systems provide adequate sensitivity for spoilage detection but may not identify specific compounds at trace concentrations [51]. Selectivity represents a key differentiator: GC-IMS can separate and identify individual compounds in complex mixtures, while E-nose systems generate composite responses that represent overall aroma profiles without compound-specific information [31] [51].
Table 2: Performance Characteristics in Food Spoilage Detection
| Parameter | Electronic Nose | GC-IMS |
|---|---|---|
| Sensitivity | Moderate (suitable for spoilage level detection) | High (ppb-ppt detection limits) |
| Selectivity | Low (pattern-based recognition) | High (compound separation and identification) |
| Analysis Speed | Fast (typically <10 minutes) | Moderate (typically 10-50 minutes) |
| Throughput | High | Moderate |
| Identification Capability | Limited to pattern recognition | Specific compound identification |
| Quantification | Semi-quantitative | Fully quantitative |
| Database Dependency | Requires extensive training with known samples | Compound identification using reference standards |
Experimental Data and Application Performance
Case Study: Freshness Evaluation in Seafood
A comprehensive study comparing four Chinese freshwater fishes (Hypophthalmichthys molitrix, Aristichthys nobilis, Lateolabrax japonicus, and Parabramis pekinensis) demonstrated the application of both GC-IMS and ultrafast GC E-nose for distinguishing species and processing states (raw vs. cooked) [53]. Researchers extracted VOCs from fish samples and analyzed them using both platforms. The GC-IMS analysis identified 20 specific compounds, including 5 aldehydes, 8 alcohols, 6 ketones, and 3 esters, providing molecular-level insight into the odor profiles. Meanwhile, the uf-GC E-nose isolated 32 compounds using the MTX-5 column and 24 compounds using the MXT-1701 column, enabling rapid fingerprinting [53].
Principal Component Analysis (PCA) of data from both instruments successfully discriminated the four fish species and clearly separated raw from cooked samples. The GC-IMS provided more detailed compound identification, while the uf-GC E-nose offered a faster, non-destructive approach for flavor analysis. The study concluded that both techniques could be developed further to distinguish aquatic products based on VOCs, with GC-IMS offering superior identification capabilities and uf-GC E-nose providing advantages in speed and cost [53].
In another study focusing on seafood freshness monitoring throughout the distribution chain, a portable E-nose system equipped with four metal oxide semiconductor sensors, a photoionization detector, and two electrochemical cells was used to assess five seafood products (cuttlefish, red mullet, Atlantic cod, Atlantic mackerel, and mantis shrimp) [52]. The research established E-nose-based control charts with warning and control limits that were validated against traditional microbial analyses (Total Viable Count). The sigmoidal curves describing microbial growth and odor evolution during storage demonstrated the E-nose's capability for rapid quality assessment in practical distribution scenarios [52].
Case Study: Meat and Processed Food Analysis
Research on meat quality assessment has demonstrated the effectiveness of E-nose systems for detecting spoilage. One study highlighted the application of metal oxide semiconductor (MOS) sensors in monitoring volatile compounds associated with meat deterioration, including nitrogen oxides and sulfides [51]. The technology successfully differentiated freshness states using pattern recognition algorithms, providing a rapid alternative to traditional microbiological methods.
In a study on Douchi (fermented soybeans), researchers employed an integrated approach using both E-nose and GC-IMS to assess the impact of aroma-enhancing microorganisms [35]. The E-nose analysis revealed significant changes in response values for nitrogen oxides and sulfide compounds after fermentation with Geotrichum candidum and Candida versatilis. Subsequent GC-IMS analysis identified 17 differential volatile metabolites, including key compounds like benzaldehyde, benzene acetaldehyde, 3-octanone, and ethyl 2-methylbutyrate [35]. This combined approach demonstrated how E-nose could provide rapid screening while GC-IMS delivered detailed molecular insights into the fermentation process.
Case Study: Sesame Oil Quality Assessment
A recent investigation compared the VOC profiles of sesame oil produced using three different processing methods: water substitution, cold-pressing, and hot-pressing [31]. The study employed both Heracles Neo ultra-fast gas-phase electronic nose and GC-IMS technologies, detecting a total of 74 VOCs across the samples.
GC-IMS detected 60 VOCs, while the electronic nose identified 22 VOCs, with 8 compounds detected by both techniques. The water substitution method oil contained over 42 VOCs, including cyclopentanone and 1-pentanol, resulting in a unique, rich flavor. Cold-pressed oil contained 4 VOCs, including γ-terpinene with a fruity flavor, while hot-pressed oil contained 29 VOCs, including 2-methyl-1-propanol, contributing to a pronounced fat aroma [31]. This research demonstrated how both techniques can elucidate the impact of processing methods on food flavor profiles, with GC-IMS providing more comprehensive compound coverage.
Experimental Protocols and Methodologies
Standard GC-IMS Protocol for Food Analysis
Based on the sesame oil study [31], a standard GC-IMS protocol for food analysis includes the following steps:
Sample Preparation: Place 1 mL of sample into a 20 mL headspace vial. For solid foods, homogenize and use a consistent weight (typically 1-5 g).
Headspace Generation: Incubate the vial at 80°C for 15 minutes with constant agitation to achieve equilibrium between the sample and headspace.
Injection: Inject 200 μL of headspace gas into the GC-IMS in splitless mode.
Chromatographic Separation: Use a moderately polar capillary column (e.g., MXT-wax, 15 m × 0.53 mm, 1.0 μm). Employ a temperature program starting at 40°C and ramping to 240°C at a defined rate.
IMS Detection: Operate the drift tube at 45°C with nitrogen drift gas (purity ≥ 99.999%) at a flow rate of 150 mL/min. Use electric field strength of 500 V/cm in positive ion mode with a tritium ionization source.
Data Analysis: Process the two-dimensional data using specialized software (e.g., GC-IMS Library Search) for compound identification and quantification.
Standard Electronic Nose Protocol for Food Analysis
Based on multiple studies [31] [52] [51], a standard E-nose protocol includes:
Sample Preparation: Place 5 g of sample into a 20 mL headspace vial. For solid foods, ensure consistent particle size and distribution.
Headspace Generation: Incubate at 80°C for 20 minutes to allow volatile accumulation.
Sensor Array Exposure: Expose the sensor array to the headspace gas. The exposure time varies by sensor type but typically ranges from 30-60 seconds.
Signal Acquisition: Record sensor responses throughout the exposure period. MOS sensors typically measure resistance changes, while CP sensors track conductivity variations.
Sensor Purge: Clean the sensors with purified air or nitrogen between measurements to reset baseline responses.
Data Processing: Apply pattern recognition algorithms (PCA, LDA, ANN) to the multidimensional sensor data to classify samples.
Integrated GC-IMS and E-Nose Protocol
For comprehensive analysis, researchers can employ both techniques sequentially [31] [35]:
Sample Division: Split homogeneous samples into aliquots for parallel analysis.
Simultaneous Headspace Generation: Prepare identical headspace vials under the same conditions.
Parallel Analysis: Run GC-IMS and E-nose analyses simultaneously to minimize sample variation.
Data Integration: Correlate E-nose fingerprint patterns with GC-IMS compound identifications using multivariate statistics.
Validation: Confirm results with complementary techniques like GC-MS or sensory evaluation when necessary.
Technology Selection Guide
Decision Framework for Technique Selection
The choice between GC-IMS and E-nose depends on research objectives, sample type, and resource constraints. The following diagram illustrates the decision pathway for selecting the appropriate analytical technology:
Complementary Approaches and Hybrid Applications
Research increasingly demonstrates the value of combining both techniques for comprehensive food quality assessment. The integrated analysis of Douchi aroma profiles exemplifies this approach [35]. In this study, E-nose provided rapid screening of multiple samples, while GC-IMS delivered detailed molecular information on specific compounds of interest. This hybrid methodology offers both high-throughput capability and detailed compound identification, making it particularly valuable for research applications requiring both speed and molecular specificity.
Another emerging approach involves using E-nose systems for continuous monitoring in production or storage environments, with GC-IMS serving as a confirmatory technique for samples flagged as anomalous. This combination leverages the strengths of both technologies while mitigating their individual limitations [52] [18].
Research Reagent Solutions and Essential Materials
Table 3: Essential Research Materials for Food Spoilage Analysis
| Category | Specific Items | Research Function | Application Examples |
|---|---|---|---|
| Reference Standards | Ketone series (C5-C9), Alcohol standards, Aldehyde mixtures | Instrument calibration and compound identification | Establishing retention index databases for GC-IMS [31] |
| Calibration Compounds | 2-butanone, 2-pentanone, 2-hexanone, 2-heptanone, 2-octanone, 2-nonanone | Creating calibration curves for quantification | VOC quantification in sesame oil [31] |
| Sample Preparation | Headspace vials (20 mL), Septa, Solid-phase microextraction (SPME) fibers | Volatile compound extraction and introduction | Fish VOC analysis [53] |
| Sensor Materials | Metal oxide semiconductors (MOS), Conducting polymers (CP), Quartz crystal microbalances (QCM) | E-nose sensor array fabrication | Meat spoilage detection [51] |
| Data Analysis Tools | PCA algorithms, LDA software, Artificial Neural Networks (ANN) | Pattern recognition and classification | Fish freshness monitoring [52] [53] |
Both GC-IMS and electronic nose technologies offer powerful capabilities for spoilage detection and freshness evaluation in meat, seafood, and produce. GC-IMS provides superior compound identification and quantification, making it ideal for research applications requiring detailed molecular information. Electronic nose systems offer advantages in speed, portability, and cost-effectiveness, suitable for quality control and high-throughput screening. The optimal choice depends on specific research objectives, with combined approaches often providing the most comprehensive solution. As both technologies continue to evolve, their application in food quality assessment is expected to expand, offering researchers increasingly powerful tools for ensuring food safety and quality.
Adulteration and Authenticity Control in High-Value Products like Honey and Olive Oil
Food authenticity and adulteration present significant economic and safety concerns within the food industry, especially for high-value products such as olive oil and honey. Economically Motivated Adulteration (EMA) involves the fraudulent substitution or addition of substances to increase a product's apparent value or reduce production costs, posing risks to consumer health and market integrity [54]. Verification of authenticity is crucial for protecting consumers, ensuring fair trade, and supporting products with designated origins (e.g., PDO, PGI) [54] [55].
The volatile organic compound (VOC) profile of a food product is a unique identifier, making it a powerful target for authenticity assessment. In this context, Gas Chromatography-Ion Mobility Spectrometry (GC-IMS) and Electronic Nose (E-Nose) systems have emerged as potent, rapid analytical tools. This guide provides an objective comparison of their performance, supported by experimental data, for researchers and scientists focused on food quality and drug development.
Electronic Nose (E-Nose)
The E-Nose is an artificial olfactory system designed to mimic the human sense of smell. Its core components are a sample delivery system, a detection unit with a sensor array, and a computing unit for data processing [12].
- Working Principle: Volatile compounds from a sample are introduced into the sensor array chamber. Each sensor in the array has partial specificity, and interactions between VOCs and sensor coatings cause changes in electrical properties (e.g., resistance), which are converted into digital signals [12] [10].
- Sensor Types: Common sensors include Metal Oxide Semiconductors (MOS), conducting polymers, and surface acoustic wave (SAW) sensors. MOS sensors are widely used due to their chemical stability, low moisture response, and reasonable cost [12].
- Data Output: The output is a multivariate fingerprint representing the overall sample aroma, without separating or identifying individual compounds [54].
Gas Chromatography-Ion Mobility Spectrometry (GC-IMS)
GC-IMS is a hyphenated technique that combines the separation power of gas chromatography with the rapid detection of ion mobility spectrometry.
- Working Principle: Sample VOCs are first separated in a GC column. The separated compounds are then ionized and introduced into a drift tube filled with an inert gas under a constant electric field. Ions are separated based on their size, shape, and charge as they drift against the counter-current gas, resulting in a drift time [56] [57].
- Data Output: The technique generates a 2D map (retention time vs. drift time) that allows for the visualization of the volatile fingerprint and, crucially, the identification of individual compounds [56] [10].
The fundamental difference lies in their approach: the E-Nose provides a rapid, holistic fingerprint, while GC-IMS offers a separated, more detailed fingerprint with compound identification capabilities.
Visualizing the Analytical Workflows
The diagram below illustrates the core operational workflows for both E-Nose and GC-IMS systems, highlighting the key steps from sample introduction to data output.
Comparative Performance Analysis
The following tables summarize the technical specifications and performance data of GC-IMS and E-Nose systems based on published research.
Technical Specifications and Analytical Performance
Table 1: Comparison of technical characteristics and performance metrics for GC-IMS and E-Nose.
| Feature | GC-IMS | Electronic Nose (E-Nose) |
|---|---|---|
| Principle | GC separation + Ion mobility detection | Chemical sensor array + Pattern recognition |
| Separation | Yes (Two-dimensional: GC retention & ion drift time) | No (Holistic fingerprint) |
| Compound Identification | Yes (via RI and drift time) [14] [56] | No |
| Sensitivity | High (ppb-ppt range) [56] | Varies (generally high for applications) [12] |
| Analysis Speed | Minutes to tens of minutes (e.g., 20-40 min) [56] | Very fast (seconds to minutes) [12] [58] |
| Sample Preparation | Minimal (headspace injection) | Minimal to none (headspace analysis) |
| Data Output | 2D VOC fingerprint (retention vs. drift time) | 1D sensor response pattern |
| Key Strengths | High sensitivity, compound identification, robust libraries | Extreme speed, portability, low cost per analysis |
Application Performance in Food Authenticity
Table 2: Performance of GC-IMS and E-Nose in specific food authenticity applications.
| Application | Technology | Experimental Summary & Classification Performance |
|---|---|---|
| Olive Oil Authentication | GC-IMS | Analysis of 268 olive oil samples (EVOO, VOO, LOO). OPLS-DA models achieved classification rates of 83-100% for different quality grades [56]. |
| E-Nose (FGC-Enose) | Used to detect soft-refined olive oil adulteration in EVOO. Demonstrated ~100% specificity in identifying adulterated samples (down to 10% adulteration) when using recent harvest EVOO for model training [57]. | |
| Orange Juice Adulteration | E-Nose (Ultra-fast GC) | Distinguished 100% orange juice from samples adulterated with as little as 1% apple juice using supervised pattern recognition [58]. |
| Essential Oil Authentication | GC-IMS & E-Nose | Combined with PCA/LDA, both techniques could accurately distinguish star anise essential oils extracted via different methods. GC-IMS was noted for its superior accuracy and rapidity [14]. |
Experimental Protocols for Authenticity Control
To ensure reproducible results, standardized experimental protocols are essential. Below are detailed methodologies for both GC-IMS and E-Nose analysis, as applied in authenticity research.
Standardized E-Nose Protocol for Liquid Samples (Fruit Juices, Oils)
This protocol is adapted from studies on juice and oil adulteration [57] [58].
Sample Preparation:
- Weigh 5.0 g of homogenized sample (e.g., olive oil, honey, or juice) into a 40 mL headspace vial.
- Seal the vial immediately with a silicone/PTFE septum cap.
Equilibration:
- Incubate the sample at a constant temperature (e.g., 40°C) for a set time (e.g., 30 min) to allow volatile compounds to reach equilibrium in the headspace.
E-Nose Data Acquisition:
- Use a flush time of 80 s with synthetic air (99.99% purity) to clean the sensor array and establish a baseline.
- Inject the sample headspace via a pump (e.g., at 400 mL/min) for measurement.
- Acquire data for 100 s, recording the stable sensor response from the array.
- Critical parameters: Measurement time, flush time, chamber flow rate, and sensor operating temperature must be kept constant for all samples [14] [58].
Standardized GC-IMS Protocol for Oils and Complex Matrices
This protocol is based on work mapping olive oil authenticity and analyzing complex food volatiles [14] [56].
Sample Preparation & Introduction:
- Weigh 100 mg - 2 g of sample into a headspace vial and seal.
- Incubate at a higher temperature (e.g., 60-85°C for 5-10 min) with agitation (e.g., 500 rpm) to drive volatiles into the headspace.
- Automatically inject a precise volume (e.g., 100-500 µL) of the headspace in splitless mode.
GC-IMS Data Acquisition:
- Chromatographic Separation: Use a mid-polarity capillary column (e.g., FS-SE-54-CB-1, 15-30 m). Employ a temperature program or isothermal conditions (e.g., 40-60°C). Nitrogen carrier gas flow can be kept constant or ramped (e.g., 2 mL/min initial, up to 150 mL/min).
- Ion Mobility Detection: The drift tube temperature is typically set at 40-45°C. Use nitrogen as the drift gas at a flow rate of 150 mL/min. The electric field strength is set according to the instrument's specifications.
Essential Research Reagent Solutions
Successful implementation of these techniques requires specific reagents and materials. The following table details key items and their functions in the analytical workflow.
Table 3: Essential research reagents and materials for GC-IMS and E-Nose analysis.
| Item | Function / Role in Analysis |
|---|---|
| Internal Standards (e.g., 2,4,6-Trimethylpyridine) [28] | Used in GC-IMS and GC-MS for signal alignment, retention index (RI) calculation, and quality control. |
| n-Alkane Standard Mixture (e.g., C5-C32) [28] | Essential for determining Kovats Retention Indices (RI) in GC systems, enabling compound identification. |
| High-Purity Carrier Gases (N₂, ≥99.999%) [14] [28] | Serves as the carrier gas in GC-IMS and drift gas in the IMS drift tube. Critical for preventing contamination and ensuring stable baseline. |
| High-Purity Synthetic Air (≥99.99%) [12] | Used as the carrier gas and for purging/pneumatic control in many E-Nose systems (e.g., PEN3). |
| Solid-Phase Microextraction (SPME) Fibers (e.g., DVB/CAR/PDMS) [28] | Optional pre-concentration step for GC-MS analysis to enhance sensitivity for trace-level volatiles. |
| Reference Chemical Standards | Pure volatile compounds (e.g., hexanal, limonene, anethole) are necessary to validate identifications by matching retention and drift times in GC-IMS [14] [10]. |
Both GC-IMS and E-Nose are powerful screening tools for food authenticity, each with distinct advantages. The choice between them depends on the specific research or quality control objectives.
- GC-IMS excels when compound identification and high sensitivity are required. Its ability to separate and tentatively identify volatile markers provides a deeper level of analytical insight, which is invaluable for confirming adulteration and understanding compositional changes. Its slightly longer analysis time is a trade-off for richer data [14] [56] [10].
- E-Nose is superior for high-throughput, rapid screening where the goal is simple classification (authentic vs. adulterated) rather than compositional detail. Its speed, portability, and lower operational cost make it ideal for at-line quality control and rapid fraud detection [12] [54] [58].
For a comprehensive authenticity control system, these techniques can be complementary. An E-Nose can be used for primary, rapid screening of large sample sets, with suspect samples subsequently referred to GC-IMS for confirmatory analysis and marker identification. This tandem approach provides an efficient, robust, and scientifically rigorous strategy for safeguarding the integrity of high-value food products.
Overcoming Challenges: Sensor Drift, Data Complexity, and Analytical Optimization
Addressing Sensor Drift and Environmental Interference in E-Nose Systems
The pursuit of rapid, accurate, and non-destructive food quality assessment has positioned Electronic Nose (E-Nose) and Gas Chromatography-Ion Mobility Spectrometry (GC-IMS) as two pivotal analytical technologies. E-Nose systems, which mimic the human olfactory system using sensor arrays and pattern recognition algorithms, offer the advantages of portability, real-time analysis, and ease of use [29] [18]. GC-IMS combines the separation power of gas chromatography with the rapid detection of ion mobility spectrometry, providing high sensitivity and selectivity for volatile organic compound (VOC) profiling [31] [59]. However, a significant challenge hindering the broader adoption of E-Nose technology, especially in precision-demanding applications like pharmaceutical development and food safety, is its vulnerability to sensor drift and environmental interference. These phenomena can degrade sensor performance over time, leading to unreliable data and necessitating frequent recalibration [29] [60]. This guide provides a comparative analysis of how E-Nose and GC-IMS systems handle these critical limitations, offering researchers a objective framework for technology selection based on performance data and experimental evidence.
Performance Comparison: E-Nose versus GC-IMS
The core operational differences between E-Nose and GC-IMS lead to distinct performance profiles, particularly concerning drift and interference. The table below provides a summary of their characteristics and performance in food quality applications.
Table 1: Performance Overview of GC-IMS and Electronic Nose
| Feature | GC-IMS | Electronic Nose (E-Nose) |
|---|---|---|
| Core Principle | Physical separation of VOCs followed by drift time measurement [31] [59] | Cross-reactive sensor array with pattern recognition [29] [18] |
| Primary Output | Detailed VOC fingerprint with compound identification [31] | Composite "smell-print" or pattern for classification [18] |
| Key Strength | High sensitivity & selectivity; robust to sensor drift [31] | Portability, speed, and low cost per analysis [18] [22] |
| Key Limitation | Higher instrument cost & complexity; longer analysis time | Susceptibility to sensor drift and environmental interference [29] [60] |
| Typical Analysis Time | Minutes to tens of minutes (e.g., 50 min [31]) | Seconds to minutes (e.g., 90 s [61]) |
| Data Complexity | High-dimensional, suitable for untargeted analysis [31] | Lower-dimensional, optimized for classification [18] |
Experimental Evidence: A Case Study in Sesame Oil Quality
A direct comparison of the technologies in a controlled experiment offers the most insightful performance data. A 2025 study investigating the impact of processing methods on sesame oil volatiles provides a perfect case study, as it employed both Heracles NEO (an ultra-fast GC-based E-Nose) and GC-IMS on the same samples [31] [59].
Experimental Protocol
- Sample Preparation: Sesame oil was extracted from the same batch of seeds using three methods: water substitution (SS-01), cold-pressing (SS-02), and hot-pressing (SS-03). This ensured differences were due to processing, not raw material [31] [59].
- GC-IMS Analysis: A FlavorSpec GC-IMS was used. Parameters included an incubation temperature of 80°C for 15 min, a 50 min run time, and a drift gas (N₂) flow rate of 150 mL/min [31].
- E-Nose Analysis: The Heracles NEO ultra-fast gas-phase E-Nose was used. Parameters included an incubation temperature of 80°C for 20 min, an injection volume of 5000 μL, and an acquisition time of 190 s [31].
- Data Processing: The data from both instruments were subjected to chemometric analysis (e.g., PCA, LDA) to discriminate between the oil samples based on their volatile profiles [31] [61].
Results and Comparative Data
The study yielded quantitative data on the volatile profiling capabilities of both systems, highlighting their respective advantages.
Table 2: Volatile Compound Detection in Sesame Oil: GC-IMS vs. E-Nose
| Metric | GC-IMS | Heracles NEO E-Nose |
|---|---|---|
| Total VOCs Detected | 60 compounds [31] | 22 compounds [31] |
| Overlapping VOCs | 8 compounds detected by both techniques [31] | |
| Key Aroma Compounds Identified | Water substitution oil: Cyclopentanone, 1-Pentanol [31] | Provides a faster, less specific fingerprint for rapid classification [31] |
| Cold-press oil: γ-Terpinene (fruity) [31] | ||
| Hot-press oil: 2-methyl-1-propanol (fatty) [31] | ||
| Discrimination Power | Effectively differentiated all three processing methods based on detailed VOC profiles [31] | Effectively differentiated all three processing methods based on pattern recognition [31] |
This experiment demonstrates that while GC-IMS provides a more comprehensive volatile profile, a sophisticated E-Nose can achieve comparable discrimination results for classification purposes. However, the E-Nose's performance in this controlled setting does not fully reflect the challenges of sensor drift and interference in long-term, real-world use.
Sensor Drift and Interference in E-Nose Systems
Understanding the Challenges
For E-Noses, the core limitations can be categorized as follows:
- Sensor Drift: A long-term change in the sensor's response characteristics over time, even under identical conditions. It is often caused by physical aging of sensor materials, chemical poisoning, or fouling [29] [60].
- Environmental Interference: Short-term fluctuations in sensor response due to changes in operational conditions such as temperature, humidity, and atmospheric pressure, or the presence of background VOCs [60].
These issues are particularly acute for the most common class of E-Nose sensors, Metal Oxide Semiconductors (MOS), which are highly sensitive to environmental factors [29] [60].
Quantifying the Impact: Experimental Data on Interference
Research has quantified the performance degradation caused by environmental interference and demonstrated the efficacy of compensation models. The following table summarizes findings from specific experiments.
Table 3: Experimental Data on E-Nose Interference and Mitigation
| Interference Source | E-Nose System | Impact on Performance | Compensation Method | Result After Compensation |
|---|---|---|---|---|
| Humidity [60] | 8 QCM sensor array | Impaired concentration prediction of toluene | PCA + ANN compensation model | Reduced avg. absolute relative error to 1.15% |
| Temperature & Humidity [60] | 4 MOS sensor array for tea/spice aroma | Reduced classification accuracy | Coefficient-based compensation + ANN | Increased recognition rate by 4-5% |
| Complex Background (Tobacco Baking) [60] | MOS-based E-Nose | Strong periodic background interference (coal smell) | Cascaded Low-Pass Filter + PCA + ICA | Effective separation of target smell from environmental interference |
Mitigation Strategies and Technological Innovations
The research community has developed a multi-faceted approach to combat sensor drift and interference, ranging from hardware improvements to advanced data processing algorithms.
Algorithm-Centric Approaches
- Drift Compensation Models: Techniques like Principal Component Analysis (PCA) and Independent Component Analysis (ICA) are used to separate environmental interference from the meaningful chemical signal in the sensor data [60].
- Advanced Pattern Recognition: Machine learning algorithms, including Support Vector Machines (SVM), Artificial Neural Networks (ANN), and Convolutional Neural Networks (CNN), are trained on data that includes variations in environmental conditions, making the models more robust [29] [18].
- Transfer Learning and Adaptive Methods: These are emerging as powerful tools for updating models with new data to adapt to drift without requiring full recalibration [60].
- Multi-Sensor Fusion with SNNs: A 2024 study proposed using a Spiking Neural Network (SNN) to fuse data from multiple sensors for estimating odor source distance. This bio-inspired approach demonstrated superior performance (RMSE < 0.1 m) compared to single-sensor indicators, showing better resilience in turbulent environments [62].
Hardware and System Design Approaches
- Environmental Control: Miniaturized heating elements (like thin-film titanium heaters) maintain sensors at a constant temperature, mitigating drift caused by ambient temperature fluctuations [60].
- Integrated Environmental Sensors: Incorporating dedicated temperature and humidity sensors into the array allows the system to measure and digitally compensate for these variables [60].
- Sensor Material Innovation: The exploration of new materials, such as carbon nanotubes (CNTs), conducting polymers (CP), and bioelectronic sensors, aims to create sensors with inherent higher stability and selectivity [18] [22].
The following diagram illustrates the major sources of interference and the corresponding mitigation strategies deployed in a modern E-Nose system.
The Scientist's Toolkit: Key Reagents and Materials
The implementation of robust E-Nose and GC-IMS studies relies on a set of core components and reagents. The following table details essential items referenced in the cited experiments.
Table 4: Essential Research Reagents and Materials
| Item Name | Function / Description | Example from Research Context |
|---|---|---|
| Metal Oxide Semiconductor (MOS) Sensors | The most common sensor type in E-Noses; detects VOCs via changes in electrical resistance. Highly sensitive but prone to drift [29] [60]. | Used in a 4-sensor array for tea and spice aroma discrimination [60]. |
| Quartz Crystal Microbalance (QCM) Sensors | Mass-sensitive sensors that detect gas adsorption by measuring shifts in resonant frequency [18]. | Used in an 8-sensor array for toluene detection, with humidity compensation [60]. |
| GC-IMS Calibration Standards | A series of known compounds used to calibrate the instrument's retention time and drift time. | 6 ketones (C5-C9) were used to establish a calibration curve for sesame oil analysis [31] [59]. |
| Chemometric Software Packages | Software for multivariate data analysis, essential for processing sensor array data and building classification models. | Algorithms like PCA, LDA, and ANN are used for data dimensionality reduction and pattern recognition [31] [18] [60]. |
| Headspace Vials / Sampling System | A controlled environment for incubating samples and extracting the volatile headspace for analysis. | 20 mL headspace vials were used for both GC-IMS and Heracles NEO E-Nose analysis of sesame oil [31]. |
The choice between E-Nose and GC-IMS for food quality assessment is fundamentally a trade-off between robustness and operational agility. GC-IMS, with its physical separation of VOCs, is inherently less susceptible to sensor drift and environmental interference, making it an excellent tool for definitive, high-fidelity volatile profiling in controlled laboratory settings [31]. Conversely, the E-Nose offers unparalleled advantages in speed, cost, and portability, making it ideal for at-line or online quality monitoring [18]. However, its reliability is contingent upon the effective implementation of a suite of mitigation strategies—from hardware design to advanced AI-driven data processing—to overcome its inherent vulnerability to drift and interference [29] [60]. For researchers, the decision pathway is clear: opt for GC-IMS when definitive compound identification and maximum data stability are required, and select an E-Nose equipped with modern drift-compensation capabilities when the application demands speed, scalability, and lower operational cost, and can tolerate a higher degree of uncertainty. Future advancements in stable sensor materials and adaptive machine learning models are critical for closing this performance gap and unlocking the full potential of E-Nose technology.
Managing Complex Data and Enhancing Sensitivity in GC-IMS Analysis
The assessment of food quality and authenticity heavily relies on the accurate analysis of volatile organic compounds (VOCs) that constitute a product's aroma profile. Among the available analytical techniques, Gas Chromatography-Ion Mobility Spectrometry (GC-IMS) and electronic nose (E-nose) systems have emerged as powerful tools with complementary strengths and limitations. GC-IMS combines the separation power of gas chromatography with the rapid detection capability of ion mobility spectrometry, offering high sensitivity and selectivity for VOC analysis [31] [10]. In contrast, E-nose technology utilizes an array of semi-selective sensors with pattern recognition to mimic human olfactory perception, providing rapid fingerprinting of complex aromas without compound separation [22]. This guide provides a comprehensive comparison of these technologies, focusing on their capabilities for managing complex data and enhancing analytical sensitivity, with direct implications for food quality assessment research and industrial applications.
Technology Comparison: Principles and Performance Characteristics
Fundamental Operating Principles
GC-IMS operates on a two-dimensional separation principle where VOCs are first separated by polarity and retention time in the GC column, followed by differentiation based on ion mobility in the drift tube under an electric field. This dual separation mechanism enables excellent resolution of complex mixtures [10] [59]. The ionization source (typically tritium or americium-241) creates reactant ions that interact with analyte molecules, forming product ions whose drift times are characteristic of their size, shape, and charge [63].
Electronic Nose systems employ an array of chemical sensors with partial specificity that generate a collective response pattern to complex odor mixtures. Common sensor technologies include metal oxide semiconductors (MOS), conducting polymers (CP), quartz crystal microbalances (QCM), and surface acoustic wave (SAW) devices [22]. Unlike GC-IMS, E-nose does not separate individual compounds but provides a holistic fingerprint that can be correlated with sensory properties through multivariate pattern recognition [10] [64].
Performance Comparison and Applications
Table 1: Comparative Analysis of GC-IMS and Electronic Nose Technologies
| Parameter | GC-IMS | Electronic Nose |
|---|---|---|
| Detection Principle | Two-dimensional separation (GC + IMS) | Sensor array response pattern |
| Sensitivity | High (ppb-ppt range) [10] | Moderate (typically ppm range) [22] |
| Analysis Time | 10-50 minutes [31] [59] | 1-5 minutes [22] |
| Compound Identification | Specific compound identification with library matching [65] | Class-based identification without compound separation [22] |
| Sample Throughput | Moderate | High |
| Data Complexity | High (3D data: retention time, drift time, intensity) [10] | Moderate (sensor response vectors) |
| Sample Preparation | Minimal (often headspace injection) [5] | Minimal (direct headspace analysis) |
| Key Applications | VOC profiling, authenticity verification, origin tracing [65] [14] | Quality grading, freshness monitoring, process control [22] |
Table 2: Classification Accuracy in Food Quality Applications
| Application | Technology | Classification Accuracy | Reference |
|---|---|---|---|
| Sesame oil processing method discrimination | GC-IMS + E-nose | High differentiation of water substitution, cold-pressing, hot-pressing | [31] [59] |
| Amomi Fructus authenticity testing | HS-GC-IMS + E-nose | 100% authenticity identification after PCA | [65] |
| Food scent classification | E-nose (IMS-based) | >99% with optimized classifiers (SVC, MLP) | [63] |
| Star anise essential oil discrimination | GC-IMS | Accurate differentiation of extraction methods | [14] |
| Infant formula flavor analysis | GC-IMS + E-tongue + E-nose | Comprehensive flavor profile characterization | [5] |
Experimental Protocols and Methodologies
Standard GC-IMS Analysis Protocol
Based on sesame oil analysis methodologies [31] [59]:
Sample Preparation: Transfer 1 mL of sample to a 20 mL headspace vial. For solid samples, appropriate grinding and homogenization is required.
Incubation Conditions: Heat the headspace vial to 80°C and incubate for 15-30 minutes to allow volatile compound equilibrium.
Injection Parameters: Inject 200-500 μL of headspace gas in splitless mode. The injection needle temperature should be maintained at 85°C.
GC Separation: Use an MXT-5 or MXT-WAX capillary column (15-30 m length, 0.53 mm diameter). Employ a temperature gradient from 40°C to 250°C at a controlled rate of 1.0-1.5°C/s.
IMS Detection: Maintain the IMS drift tube at 45°C with an electric field strength of 500 V/cm. Use nitrogen (99.999% purity) as drift gas at a flow rate of 150 mL/min.
Data Acquisition: Acquire data for 20-50 minutes using positive ion mode. Perform triplicate measurements for statistical reliability.
Electronic Nose Analysis Protocol
Based on food aroma analysis studies [64] [22] [5]:
Sample Presentation: Place 2-8 mL of sample in a 20-40 mL headspace vial. Ensure consistent headspace volume across samples.
Equilibrium Conditions: Incubate at 40-60°C for 5-20 minutes with optional agitation at 500-960 rpm.
Measurement Phase: Inject headspace gas at a flow rate of 300-450 mL/min. Acquire sensor responses for 100-200 seconds until stabilization.
Sensor Cleaning: Purge the system with filtered air for 300 seconds between samples to reestablish baseline.
Data Collection: Record the maximum response or steady-state response from each sensor in the array. Perform multiple replicates (typically n=3-5).
Data Processing and Multivariate Analysis
Both technologies require sophisticated data processing:
GC-IMS Data Processing:
- Use LAV, GC-IMS Library Search, or similar software
- Perform peak alignment, normalization, and compound identification using retention index and drift time databases
- Generate VOC fingerprints and differential comparative plots
- Apply PCA, LDA, or PLS-DA for pattern recognition [65] [14]
Electronic Nose Data Processing:
- Normalize sensor response data (typically to variance or range)
- Apply feature extraction (maximum response, curve parameters, etc.)
- Utilize PCA, LDA, k-NN, SVM, or artificial neural networks for classification [63] [22]
- For IMS-based e-noses, k-NN with alternative distance metrics can achieve misclassification rates below 1% [63]
Figure 1: Comparative Workflows of GC-IMS and Electronic Nose Technologies
Advanced Data Management Strategies
Handling Complex GC-IMS Data
GC-IMS generates three-dimensional data (retention time, drift time, intensity) that requires specialized processing [10]. Effective management strategies include:
Dimensionality Reduction: Apply Principal Component Analysis (PCA) to reduce data complexity while preserving meaningful variation. In Amomi Fructus analysis, PCA achieved 100% accuracy in authenticity identification when combined with GC-IMS data [65].
Fingerprint Analysis: Develop VOC fingerprints for rapid comparison using gallery plots and differential maps. This approach successfully distinguished star anise essential oils extracted by different methods [14].
Data Fusion: Combine GC-IMS data with complementary techniques (E-nose, E-tongue) for enhanced classification. Data-level fusion of E-nose and HS-GC-IMS improved origin identification accuracy to 97.96% compared to single-technique analysis [65].
Optimizing E-nose Data Analysis
E-nose systems benefit from advanced pattern recognition:
Classifier Optimization: Test multiple algorithms (k-NN, SVM, LDA, QDA, ANN) to identify optimal performance. One comprehensive study found Quadratic Discriminant Analysis, MLPClassifier, and C-Support Vector Classification achieved misclassification rates below 1% for food scent classification [63].
Sensor Selection: Identify and utilize the most informative sensors for specific applications. In infant formula analysis, metal oxide sensors W5S (nitrogen oxides), W1S (methane), and W2S (alcohols, ketones, aldehydes) showed the highest response values and greatest discriminatory power [5].
Drift Compensation: Implement regular calibration and algorithm-based correction to address sensor drift over time, a common challenge in E-nose systems [22].
Enhancing Analytical Sensitivity
Sensitivity Optimization in GC-IMS
Table 3: Techniques for Sensitivity Enhancement in GC-IMS
| Approach | Methodology | Effect | Application Example |
|---|---|---|---|
| Sample Pre-concentration | Headspace solid-phase microextraction (HS-SPME) | Increases VOC concentration | Aromatic compound analysis in coconut water [64] |
| Temperature Optimization | Incubation at 80°C for 15-30 minutes | Enhances volatile release | Sesame oil VOC profiling [31] |
| Drift Gas Purity | High-purity nitrogen (≥99.999%) | Reduces ion-molecule collisions | Standard GC-IMS protocol [59] |
| Ionization Source Maintenance | Regular tritium source verification | Ensures consistent ionization efficiency | Instrument quality control |
| Data Processing Algorithms | Noise filtering and peak alignment | Improves signal-to-noise ratio | VOC fingerprinting in persimmon [66] |
Sensitivity Considerations for Electronic Nose
E-nose sensitivity depends on sensor selection and operation:
Sensor Array Design: Combine complementary sensor technologies (MOS, CP, QCM, SAW) to enhance detection range and cross-sensitivity profiles [22].
Operating Temperature Optimization: Modulate sensor temperature to target specific compound classes, as sensor sensitivity varies with temperature [22].
Humidity and Temperature Control: Maintain consistent environmental conditions during analysis to minimize signal variance unrelated to sample characteristics [63].
Advanced Pattern Recognition: Employ machine learning algorithms (ANN, SVM) that can extract subtle patterns from complex sensor response data, effectively enhancing functional sensitivity [63] [22].
Essential Research Reagent Solutions
Table 4: Key Research Reagents and Materials for GC-IMS and E-nose Analysis
| Item | Function | Application Example | Technical Specifications |
|---|---|---|---|
| MXT-5 Capillary Column | GC separation of volatile compounds | Non-polar compound separation in essential oils [14] | 15-30 m length, 0.53 mm diameter, 1.0 μm film thickness |
| MXT-WAX Capillary Column | Polar compound separation | Alcohol, aldehyde, ketone separation in sesame oil [31] | 15-30 m length, 0.53 mm diameter, 1.0 μm film thickness |
| n-Ketone Calibration Standards | Retention index calibration | Instrument calibration for reproducible retention times [31] [65] | 2-butanone, 2-pentanone, 2-hexanone, 2-heptanone, 2-octanone, 2-nonanone |
| High-Purity Nitrogen Gas | GC carrier gas and IMS drift gas | Maintaining optimal ion mobility conditions [59] | ≥99.999% purity with appropriate filtration |
| Headspace Vials | Sample containment and volatile equilibrium | Standardized sample presentation [5] | 20-40 mL volume, chemical inertness, proper sealing |
| Electronic Nose Sensor Arrays | Volatile compound detection | Food quality grading and spoilage detection [22] | MOS, CP, QCM, or SAW sensors with cross-sensitive profiles |
Figure 2: Integrated Approach to Enhancing Analytical Sensitivity in VOC Analysis
GC-IMS and electronic nose technologies offer complementary approaches for food quality assessment through VOC analysis. GC-IMS provides superior compound identification capabilities, higher sensitivity, and detailed VOC profiling, making it ideal for research requiring specific compound identification and method development. Electronic nose systems deliver rapid analysis, higher throughput, and simpler operation, better suited for quality control and screening applications. The optimal technology selection depends on specific application requirements, with data fusion approaches offering the most comprehensive analytical solution. Future developments in sensor technology, miniaturization, and artificial intelligence-based pattern recognition will further enhance the capabilities of both techniques, solidifying their role in food quality assessment and broader analytical applications.
Optimizing Sensor Array Selection and GC-IMS Parameters for Specific Food Matrices
The accurate assessment of food quality and authenticity relies heavily on the precise detection of volatile organic compounds (VOCs), which serve as chemical fingerprints for characteristics like freshness, processing method, and spoilage [67]. Among the analytical techniques available, Gas Chromatography-Ion Mobility Spectrometry (GC-IMS) and electronic nose (E-nose) systems have emerged as powerful tools for VOC analysis. GC-IMS combines the high separation capability of gas chromatography with the rapid detection of ion mobility spectrometry, offering high sensitivity and the ability to operate at atmospheric pressure [68]. E-nose systems employ an array of non-specific chemical sensors coupled with pattern recognition algorithms to mimic the human olfactory system, providing rapid, on-line monitoring capabilities [18].
The core challenge for researchers lies in optimizing the selection of sensor technologies and analytical parameters for specific food matrices. The performance of these systems varies significantly depending on the target analytes and the complexity of the food sample. This guide provides a comparative analysis of GC-IMS and E-nose technologies, supported by experimental data and methodologies, to inform their targeted application in food quality assessment.
Technology Comparison: GC-IMS vs. Electronic Nose
Table 1: Fundamental characteristics of GC-IMS and E-nose technologies
| Feature | GC-IMS | Electronic Nose (E-nose) |
|---|---|---|
| Principle | Two-dimensional separation (retention time & drift time) followed by ion detection [68] | Array of cross-selective sensors with pattern recognition [18] |
| Key Output | Spectral fingerprints with compound identification capability [69] | Composite smell-prints (fingerprints) without specific compound identification [18] |
| Separation | High (Chromatographic and mobility-based) [68] | None |
| Sensitivity | ppb to ppt levels [68] | Varies by sensor type; generally high for target gases [67] |
| Analysis Speed | Minutes to tens of minutes (~10-50 min) [31] [68] | Seconds to minutes [18] |
| Compound Identification | Yes, via retention index and drift time databases [68] | No, primarily classification and discrimination |
| Sample Preparation | Minimal; often headspace injection [68] | Minimal; direct headspace sampling [18] |
Performance Comparison Across Food Matrices
Experimental studies across diverse food products demonstrate how the complementary strengths of GC-IMS and E-nose address different analytical needs.
Table 2: Comparative experimental data from food analysis studies
| Food Matrix | Analysis Goal | GC-IMS Performance | E-nose Performance | Reference |
|---|---|---|---|---|
| Sesame Oil | Discriminate processing methods (water substitution, cold-press, hot-press) | Detected 74 VOCs; identified key markers like Cyclopentanone (water substitution) and γ-terpinene (cold-press) [31] | Effectively clustered samples by processing method; complementary to GC-IMS [31] | [31] |
| Star Anise Essential Oil | Distinguish extraction methods (HD, ESE, SCD, SE) | Accurately discriminated all four methods; established detailed VOC fingerprints; noted for accuracy and rapidity [14] | Distinguished extraction methods effectively, but GC-IMS was identified as the most suitable method [14] | [14] |
| Industrial Douchi | Enhance wine and sweet aroma attributes | Identified 24 differential metabolites (e.g., ethyl 2-methylbutanoate) via PLS-DA [35] | Revealed significant changes in volatile composition; showed reduced sourness and enhanced wine-like notes [35] | [35] |
| Iberian Ham | Differentiate quality classes based on feeding regime | PLS-DA models successfully classified ham samples; data processing workflows were critical for feature extraction [69] | Not specifically tested in this study, but E-nose has been widely used for similar meat quality applications [18] | [69] |
Experimental Protocols for Food Analysis
GC-IMS Analysis of Sesame Oil Processing Methods
Sample Preparation:
- Water Substitution Method: Sesame seeds were fried at 120°C until brown, ground, mixed with hot water (1:1 ratio w/v), stirred at 350 rpm for 30 min, shaken for 4 h, and centrifuged at 6,000 rpm for 5 min [31].
- Cold-Pressing Method: Seeds were pressed at 40-60°C with pressure up to 1,600 kN, then centrifuged at 6,000 rpm for 5 min [31].
- Hot-Pressing Method: Seeds were fried for 20 min and pressed at approximately 130°C with pressure up to 1,600 kN, then centrifuged at 6,000 rpm for 5 min [31].
GC-IMS Parameters:
- Instrument: FlavorSpec GC-IMS (G.A.S.)
- Column: MXT-wax capillary column (15 m × 0.53 mm, 1.0 μm)
- Injection Volume: 200 μL in non-shunt mode
- Incubation: 80°C for 15 min
- Drift Gas: N₂ (purity ≥ 99.999%) at 150 mL/min
- Drift Tube Temperature: 45°C [31]
Integrated Analysis of Douchi Aroma Enhancement
Microbial Inoculation:
- Geotrichum candidum and Candida versatilis were added in ratios of 1:1, 1:2, and 2:1 during secondary fermentation [35].
Multi-Instrument Analysis:
- E-nose: Comprehensive aroma profiling
- GC-IMS: FlavourSpec instrument with HS injection at 85°C, FS-SE-54-CB-1 column (15 m), IMS temperature 45°C, drift gas N₂ at 150 mL/min
- GC-MS: HS-SPME extraction, HP-5MS column, He carrier gas [35]
Sensory Evaluation:
- Descriptive analysis (DA) was conducted by trained panelists to evaluate sourness, wine-like, and sweetness attributes [35].
GC-IMS Workflow and Data Processing
The analysis of GC-IMS data requires specialized workflows to handle its complex, two-dimensional nature. The following diagram illustrates the key stages from sample to results.
Figure 1: GC-IMS Analysis Workflow. The process begins with headspace sampling of volatile compounds from food samples, followed by two-dimensional separation through GC and IMS. The raw data undergoes pre-processing to correct baseline issues and misalignments before feature extraction. Finally, chemometric modeling enables sample classification or compound identification [69].
Feature Extraction Strategies for GC-IMS Data
Four principal approaches for feature extraction from GC-IMS data have been identified, each with distinct advantages:
- Total Area of Reactant Ion Peak Chromatogram (RIC): Provides a global signal intensity but loses detailed compositional information [69].
- Full RIC Response: Preserves more chromatographic detail while simplifying the IMS dimension [69].
- Unfolded Sample Matrix: Maintains the complete two-dimensional data structure, preserving the most information at the cost of computational complexity [69].
- Ion Peak Volumes: Focuses on quantifying specific, pre-identified peaks, offering targeted analysis [69].
The choice among these strategies represents a trade-off between the amount of chemical information preserved and the computational effort required [69].
Optimizing Sensor Arrays and GC-IMS Parameters
E-nose Sensor Selection by Food Application
Table 3: Sensor technologies for electronic nose systems
| Sensor Type | Principle | Optimal Food Applications | Advantages |
|---|---|---|---|
| Metal-Oxide Semiconductor (MOS) | Changes in electrical resistance upon gas exposure [67] [18] | Meat, seafood, fruit freshness; spoilage detection [67] [18] | High sensitivity, durable, long lifespan, fast response [67] [18] |
| Electrochemical | Current from redox reactions at electrodes [67] [18] | Fruit ripeness (ethylene), spoilage markers (NH₃, H₂S) [67] | High selectivity for specific gases, portable, adaptable [67] [18] |
| Conducting Polymer (CP) | Conductivity change upon gas adsorption [67] [18] | Food quality assessment, medical diagnostics [18] | Fast response, low power consumption, tunable sensitivity [67] [18] |
| Optical | Changes in light absorption/fluorescence [67] [18] | Food quality assessment, industrial gas detection [18] | Non-contact sensing, high specificity, visual results [67] |
| Quartz Crystal Microbalance (QCM) | Mass change-induced frequency shift [18] | Breath analysis, fragrance quality control [18] | High sensitivity for low-concentration gases [18] |
Critical GC-IMS Parameters for Food Analysis
Temperature Optimization:
- Drift Tube Temperature: Conventional systems operate below 100°C, but higher temperatures (up to 180°C) significantly reduce peak tailing for high-boiling point compounds like terpenes and terpenoids, improving resolution in complex matrices [70].
- Injection Temperature: Typically 80-85°C for optimal vaporization of VOCs without degrading heat-sensitive compounds [31] [14].
Flow Architecture:
- Advanced "focus IMS" designs with optimized sample and drift gas flows minimize void volumes in the ionization region, guiding sample flow directly to the outlet to reduce diffusion and improve peak shape [70].
Drift and Carrier Gases:
- Drift Gas: High-purity N₂ (≥99.999%) at flow rates of 150 mL/min is standard for stable drift times and high sensitivity [31] [70].
- Carrier Gas: N₂ can be used, offering cost and environmental benefits over He required for GC-MS [70] [68].
Essential Research Reagent Solutions
Table 4: Key reagents and materials for GC-IMS and E-nose experiments
| Reagent/Material | Function | Application Example | Reference |
|---|---|---|---|
| C4-C9 n-ketones | External standards for retention index (RI) calibration | Establishing calibration curve for VOC identification in GC-IMS | [31] [71] |
| High-purity N₂ gas (≥99.999%) | Drift and carrier gas for GC-IMS | Maintaining stable ionization and drift conditions | [31] [70] |
| Headspace Vials | Containment for volatile compound analysis | Ensuring consistent headspace generation for sampling | [31] [14] |
| SPME Fibers (e.g., PDMS/DVB) | Extraction and pre-concentration of volatiles | Headspace sampling for complementary GC-MS analysis | [35] [14] |
| Aroma-enhancing Microorganisms (e.g., G. candidum) | Biological modification of food aroma profile | Studying and improving volatile profiles in fermented foods | [35] |
Advanced Signal Processing and Data Pre-processing Techniques
In food quality research, the accurate assessment of volatile organic compounds (VOCs) is crucial for evaluating flavor profiles, authenticity, and shelf-life. Gas Chromatography-Ion Mobility Spectrometry (GC-IMS) and electronic nose (E-nose) technologies have emerged as powerful analytical tools for VOC analysis, each employing distinct signal processing and data pre-processing approaches [72] [2]. While GC-IMS provides detailed separation and identification of individual volatile compounds, E-nose technology generates composite fingerprint patterns for rapid sample classification [14]. The performance and application suitability of these technologies depend significantly on their signal processing frameworks, which transform raw instrumental responses into chemically meaningful data. This comparison guide examines the technical capabilities, experimental protocols, and data processing workflows of both technologies to inform researchers and development professionals in selecting appropriate methodologies for specific food quality assessment scenarios.
Gas Chromatography-Ion Mobility Spectrometry (GC-IMS)
GC-IMS operates as a two-dimensional separation technique that combines gas chromatographic pre-separation with ion mobility spectrometry detection. This technology separates volatile compounds based on both their chromatographic retention behavior and their drift time through a drift tube filled with an inert gas under a constant electric field [5] [73]. The resulting data is typically visualized as three-dimensional plots with retention time, drift time, and signal intensity as axes, or as two-dimensional topographic plots where each point represents a volatile compound [59] [73]. GC-IMS offers high sensitivity for VOC characterization, with detection limits often at low nanogram or picogram levels, and requires minimal sample preparation [14] [73]. The technique is particularly valued for its ability to distinguish isomeric compounds and provide structural information based on collision cross-sections in the drift tube [5].
Electronic Nose (E-Nose) Systems
Electronic nose technology employs an array of semi-selective chemical sensors that respond to broad classes of volatile compounds, mimicking the mammalian olfactory system [72] [2]. Each sensor in the array has overlapping specificities, and the combined response pattern creates a unique fingerprint for different odor profiles [2]. Common sensor technologies include Metal Oxide Semiconductors (MOS), Conducting Organic Polymers (COPs), Quartz Crystal Microbalances (QCMs), and Metal Oxide Semiconductor Field Effect Transistors (MOSFETs) [2]. Unlike GC-IMS, E-nose systems typically do not separate or identify individual compounds but rather provide pattern recognition responses that can be correlated with sensory attributes or quality parameters [14] [72]. This makes E-nose technology particularly suitable for rapid quality screening and classification tasks where specific compound identification is not required [2].
Table 1: Fundamental Characteristics of GC-IMS and Electronic Nose Technologies
| Characteristic | GC-IMS | Electronic Nose |
|---|---|---|
| Analytical Principle | Two-dimensional separation (GC + IMS) | Array-based pattern recognition |
| Data Output | 3D spectra (retention time, drift time, intensity) | Multidimensional sensor response vectors |
| Compound Identification | Specific compound identification possible | Group-type classification, no specific identification |
| Detection Limit | High sensitivity (ppt-ppb range) | Variable sensitivity (depends on sensor type) |
| Analysis Time | 10-50 minutes | 1-10 minutes |
| Sample Preparation | Minimal to moderate | Minimal |
| Throughput | Moderate | High |
Experimental Protocols and Methodologies
GC-IMS Experimental Workflow
Standard GC-IMS protocols for food analysis involve specific parameters optimized for different sample matrices. For sesame oil analysis, researchers employed a FlavorSpec GC-IMS instrument with an MXT-wax capillary column (15 m × 0.53 mm, 1.0 μm). Samples (1 mL) were placed in 20 mL headspace vials and incubated at 80°C for 15 minutes. Then, 200 μL of headspace gas was injected in splitless mode with a runtime of 50 minutes. The carrier gas flow rate was initially set at 2.0 mL/min, then linearly increased to 100 mL/min within 18 minutes and held for 30 minutes. The IMS detector operated with a tritium ionization source, 45°C drift tube temperature, 500 V/cm electric field strength, and nitrogen drift gas at 150 mL/min [31] [59].
For analysis of Rhizoma gastrodiae, the methodology was adjusted with a lower incubation temperature of 40°C for 30 minutes. The GC temperature program utilized a more gradual ramp: initial flow rate of 2 mL/min for 2 minutes, increased to 10 mL/min within 8 minutes, then to 100 mL/min over 10 minutes, and finally to 150 mL/min for 10 minutes with a 5-minute hold [73]. These methodological variations demonstrate how GC-IMS parameters are optimized based on sample volatility and complexity.
Electronic Nose Experimental Protocol
E-nose analysis protocols vary significantly depending on the sensor technology and sample type. For star anise essential oil analysis, researchers used a PEN3 E-nose with 10 different metal oxide sensors. Samples (2 mL) were placed in 40 mL headspace vials and equilibrated for 50 minutes at 20°C. The measurement parameters included: flush time of 80 seconds, measurement time of 100 seconds, zero-point trim time of 10 seconds, pre-sampling time of 5 seconds, chamber flow of 450 mL/min, and injection flow of 300 mL/min [14].
In infant formula analysis, a different set of parameters was employed: incubation at 40°C for 300 seconds with shaking at 960 rpm, followed by detection for 200 seconds with an injection flow rate of 300 mL/min [5]. The sensor array in the PEN3 system includes sensors sensitive to different chemical classes: W1S (sensitive to methane), W2S (alcohols, ketones, and aldehydes), W3S (long-chain alkanes), W4S (hydrogen), W5S (nitrogen oxides), W6S (broad-range solvents), W1W (sulfur compounds), W1C (aromatic compounds), W2W (organic sulfides), and W3C (ammonia) [5]. This diverse sensor array enables the creation of distinctive response patterns for different sample types.
Signal Processing and Data Pre-processing Techniques
GC-IMS Data Processing Pipeline
GC-IMS generates complex three-dimensional data sets that require specialized processing to extract meaningful chemical information. The initial raw data consists of ion current measurements as a function of retention time and drift time, which undergoes multiple transformation steps [74]. First, baseline correction is applied to remove instrumental offsets and drift effects. This is particularly important in IMS due to potential variations in reactant ion peak stability [74]. Next, peak detection and alignment algorithms identify and match corresponding peaks across different samples, addressing retention time shifts that may occur due to minor chromatographic variations [74].
For qualitative analysis, the retention time and drift time of unknown peaks are compared against reference standards in databases, with the drift time normalized to the reactant ion peak (RIP) to calculate reduced ion mobility values (K0) [31] [59]. Quantitative analysis typically employs peak volume or height measurements, with normalization procedures applied to account for sample-to-sample variations [73]. Advanced GC-IMS software packages include modules for generating fingerprint plots, differential comparison maps, and performing gallery plot analyses to visualize variations across multiple samples [5] [73].
Electronic Nose Signal Processing Approaches
E-nose data processing focuses on transforming multidimensional sensor responses into discriminative patterns for sample classification. The raw data consists of time-dependent sensor resistance or conductivity measurements, which are pre-processed to enhance signal quality and reduce unwanted variations [74] [2]. Common pre-processing steps include baseline correction, normalization, and feature extraction [2]. Baseline correction addresses sensor drift by subtracting initial baseline readings or using more advanced drift correction algorithms [2]. Normalization techniques, such as Standard Normal Variate (SNV) transformation or min-max scaling, mitigate the effects of concentration variations and enhance the discriminative power of the sensor patterns [74].
Feature extraction typically involves selecting specific parameters from the sensor response curves, such as maximum response value, response slope, integral value, or steady-state response [2]. These features are then assembled into a feature vector that represents each sample's odor fingerprint. Dimensionality reduction techniques, particularly Principal Component Analysis (PCA), are widely employed to visualize and analyze the high-dimensional E-nose data [5] [14] [2]. PCA transforms the original correlated sensor variables into a smaller set of uncorrelated principal components that capture the maximum variance in the data, enabling effective sample differentiation and classification [2].
Table 2: Common Data Pre-processing Techniques for GC-IMS and Electronic Nose
| Processing Step | GC-IMS Techniques | Electronic Nose Techniques |
|---|---|---|
| Baseline Correction | Linear and polynomial baseline fitting | Sensor baseline subtraction, drift correction algorithms |
| Normalization | Internal standards, total ion count | Standard Normal Variate (SNV), min-max scaling, z-score |
| Feature Extraction | Peak detection, height/volume measurement | Maximum response, curve slope, integral value, steady-state response |
| Alignment | Retention time alignment, drift time alignment | Not typically required |
| Dimensionality Reduction | PCA, PLS-DA on peak volumes | PCA, LDA on sensor features |
| Pattern Recognition | Gallery plots, fingerprinting | PCA, LDA, BPNN, SVM, random forest |
Performance Comparison and Experimental Data
Analytical Capabilities in Food Quality Assessment
Direct comparisons of GC-IMS and E-nose technologies reveal distinct performance characteristics across various food matrices. In a comprehensive study of star anise essential oils, both techniques successfully differentiated samples extracted by four different methods (hydrodistillation, ethanol solvent extraction, supercritical CO2, and subcritical extraction). However, GC-IMS demonstrated superior capability in identifying specific marker compounds, including anethole and limonene as the predominant volatiles, while E-nose provided faster analysis times but less chemical specificity [14].
For sesame oil analysis, GC-IMS detected 60 volatile organic compounds across three processing methods (water substitution, cold-pressing, and hot-pressing), while E-nose detected 22 VOCs, with 8 compounds identified by both techniques [31] [59]. The water substitution method sesame oil contained over 42 VOCs including cyclopentanone and 1-pentanol, cold-pressed oil contained 4 VOCs such as γ-terpinene with fruity notes, and hot-pressed oil contained 29 VOCs including 2-methyl-1-propanol with characteristic fat aroma [31]. This demonstrates GC-IMS's superior compound identification capabilities, while E-nose provided adequate discrimination between processing methods with faster analysis.
Classification Accuracy and Sensitivity
Studies directly comparing classification performance show technology-specific advantages. In virgin olive oil commercial category classification (extra virgin, virgin, and lampante), E-nose alone achieved classification accuracy of 77.8-86.7%, while GC-IMS achieved 75-89.6% accuracy. However, data fusion strategies combining both technologies significantly enhanced performance, with low-level data fusion improving classification of virgin olive oil by 16.6% and extra virgin olive oil by 12.0% compared to individual techniques [75]. Mid-level data fusion, which combines features extracted from each technique, showed the most effective performance with average percentage increases of 8.3±6.4% for HS-GC-IMS and 8.7±4.8% for FGC E-nose compared to single-technique models [75].
In raw milk origin discrimination, both GC-IMS and E-nose successfully differentiated samples from Southern and Northern China, though with limited discrimination between northeast, northwest, and central regions. The techniques identified key marker compounds including pyridine, nonanal, dodecane, furfural, 1-decene, octanoic acid, and 1,3,5,7-cyclooctatetraene as geographical indicators [7].
Table 3: Quantitative Performance Comparison in Food Applications
| Application | Technology | Key Performance Metrics | Reference |
|---|---|---|---|
| Virgin Olive Oil Classification | GC-IMS | 75-89.6% classification accuracy | [75] |
| E-nose | 77.8-86.7% classification accuracy | [75] | |
| Data Fusion | Up to 16.6% improvement over single techniques | [75] | |
| Sesame Oil VOC Profiling | GC-IMS | 60 VOCs identified | [31] [59] |
| E-nose | 22 VOCs identified | [31] [59] | |
| Star Anise Essential Oil | GC-IMS | Accurate identification of anethole and limonene as main compounds | [14] |
| E-nose | Successful differentiation of extraction methods | [14] | |
| Raw Milk Origin Discrimination | GC-IMS & E-nose | Successful Southern/Northern China differentiation | [7] |
The Scientist's Toolkit: Essential Research Reagents and Materials
Table 4: Essential Research Materials for GC-IMS and E-Nose Experiments
| Item | Function | Example Specifications |
|---|---|---|
| GC-IMS Instrument | VOC separation and detection | FlavorSpec (G.A.S.), Agilent GC coupled with IMS |
| GC Columns | Compound separation | MXT-5, MXT-1701, MXT-wax (15-30 m length) |
| E-Nose System | Pattern-based odor analysis | PEN3 (Airsense), Heracles NEO (Alpha MOS) |
| Headspace Vials | Sample containment and equilibration | 20-40 mL volume, crimp-top with PTFE seals |
| Internal Standards | Retention time calibration | Ketone series (C4-C9) for RI calibration |
| Drift Gases | IMS drift tube operation | N2 (purity ≥99.999%) |
| Chemical Standards | Compound identification | Pure VOC standards for database development |
| SPME Fibers | VOC extraction (optional) | 65 μm PDMS/DVB for certain applications |
GC-IMS and electronic nose technologies offer complementary approaches for food quality assessment through volatile compound analysis, with distinct advantages for specific application scenarios. GC-IMS provides superior compound identification and quantification capabilities, making it ideal for targeted analysis and mechanism elucidation where specific marker compounds need identification [31] [59] [73]. Its high sensitivity and ability to separate isomeric compounds make it particularly valuable for research requiring detailed chemical information [5] [14]. Electronic nose systems excel in rapid screening and classification tasks where speed and operational simplicity are prioritized over compound-specific information [14] [72] [2]. The technology demonstrates excellent performance for quality control applications, authenticity verification, and shelf-life monitoring where pattern recognition suffices for decision-making [2].
Emerging data fusion strategies that combine both technologies demonstrate significant performance enhancements over single-technique approaches, particularly for complex classification tasks [75]. The integration of advanced machine learning algorithms with both GC-IMS and E-nose data continues to expand the capabilities of both technologies, enabling more accurate classification models and enhanced drift correction [2]. Technology selection should be guided by specific research objectives, with GC-IMS recommended for comprehensive volatile profiling and mechanistic studies, E-nose suited for high-throughput quality screening, and combined approaches providing the highest classification accuracy for challenging discrimination tasks [75] [14].
Strategies for Real-World Deployment and Industrial Scaling
In the domain of food quality assessment, Gas Chromatography-Ion Mobility Spectrometry (GC-IMS) and Electronic Nose (E-nose) technologies have emerged as powerful tools for detecting volatile organic compounds (VOCs) that define food aroma, freshness, and authenticity [76] [19]. While both technologies analyze volatile components, they differ fundamentally in their operational principles, analytical capabilities, and suitability for industrial deployment. GC-IMS combines the high separation power of gas chromatography with the rapid detection of ion mobility spectrometry, providing detailed fingerprinting of volatile compounds with high sensitivity and selectivity [31] [14]. In contrast, E-nose systems employ an array of semi-selective chemical sensors combined with pattern recognition algorithms to generate holistic "smell-prints" of samples without separating individual compounds [12] [18].
The strategic selection between these technologies for real-world applications depends on multiple factors, including required analytical resolution, throughput demands, operational constraints, and economic considerations. This guide objectively compares the performance characteristics, experimental protocols, and scalability of GC-IMS and E-nose systems to inform researchers, scientists, and industry professionals in making evidence-based technology decisions for food quality assessment.
Technology Performance Comparison: GC-IMS vs. Electronic Nose
Table 1: Technical Specifications and Performance Characteristics
| Parameter | GC-IMS | Electronic Nose (E-nose) |
|---|---|---|
| Detection Principle | Two-dimensional separation (GC + IMS) | Chemical sensor array with pattern recognition |
| Analytical Output | Compound identification & quantification | Fingerprint pattern & classification |
| Sensitivity | High (ppb-ppt range) [5] | Moderate (ppm-ppb range) [18] |
| Selectivity | High (separates co-eluting compounds) [14] | Moderate (cross-reactive sensors) [12] |
| Analysis Time | 10-50 minutes [31] [14] | 1-10 minutes [18] [19] |
| Sample Throughput | Medium (sequential analysis) | High (parallel processing) |
| Operational Complexity | Requires technical expertise | Minimal training required |
| Portability | Benchtop systems predominant [76] | Portable & handheld systems available [18] |
| Capital Cost | High | Low to moderate |
| Operational Cost | Moderate (carrier gases) | Low |
| Data Interpretation | Library matching, chromatogram analysis | Multivariate statistics, machine learning |
Table 2: Application-Specific Performance in Food Analysis
| Food Application | GC-IMS Performance | E-nose Performance | Supporting Evidence |
|---|---|---|---|
| Edible Oil Authentication | Identified 74 VOCs across processing methods [31] | Successfully classified adulterated oils with 94.5% accuracy [12] | Sesame oil study (2025) |
| Essential Oil Analysis | Accurately distinguished extraction methods [14] | Effective classification with PCA/LDA [14] | Star anise study (2023) |
| Dairy Quality Control | Detected 41 volatile compounds in infant formula [5] | Monitored spoilage via ammonia/trimethylamine detection [19] | Multiple dairy studies |
| Meat & Seafood Freshness | Identified specific spoilage markers | Rapid freshness categorization [19] | Food quality reviews |
| Process Monitoring | Detailed pathway analysis during fermentation | Real-time fermentation tracking [19] | Industrial applications |
Experimental Protocols and Methodologies
GC-IMS Experimental Workflow
The standard protocol for GC-IMS analysis involves precise sample preparation, chromatographic separation, and ion mobility detection, as demonstrated in sesame oil VOC profiling [31]:
Sample Preparation:
- Headspace Generation: 1 mL of sample is transferred to a 20 mL headspace vial and incubated at 80°C for 15 minutes to allow volatile compound accumulation in the headspace.
- Injection: 200 μL of headspace gas is injected in splitless mode using a gastight syringe.
Instrumental Parameters (based on FlavorSpec GC-IMS):
- Chromatographic Column: MXT-wax capillary column (15 m × 0.53 mm, 1.0 μm)
- Carrier Gas: Nitrogen (purity ≥ 99.999%) with flow rate programming: initial 2.0 mL/min for 2 min, increased to 100 mL/min within 18 min
- IMS Conditions: Tritium ionization source; drift tube temperature 45°C; electric field strength 500 V/cm; drift gas flow 150 mL/min
- Analysis Duration: 50 minutes per sample
Data Processing:
- Compound Identification: Retention index calibration using ketone standards (C4-C9) and database matching
- Visualization: 2D topographic plots (retention time vs. drift time) and differential comparison modes
GC-IMS Experimental Workflow
Electronic Nose Experimental Protocol
E-nose analysis employs sensor array technology with pattern recognition, optimized for rapid sample screening [14] [12]:
Sample Presentation:
- Headspace Equilibration: 2-5 mL of sample placed in 20-40 mL headspace vials and equilibrated at 20-80°C for 5-50 minutes
- Sensor Array Exposure: Headspace gas delivered to sensor chamber at controlled flow rates (150-450 mL/min)
Sensor Technologies (varies by instrument):
- Metal Oxide Semiconductor (MOS) Sensors: Most common, high sensitivity, broad detection range
- Conducting Polymer Sensors: Good sensitivity, lower operating temperature
- Quartz Crystal Microbalance (QCM): Mass-sensitive detection
- Surface Acoustic Wave (SAW) Sensors: High sensitivity miniature systems
Data Acquisition Parameters (based on PEN3/PEN2 systems):
- Measurement Time: 80-200 seconds per sample
- Sensor Cleaning: 300-600 seconds between samples with purified air
- Data Collection: 1-10 readings per second per sensor
Pattern Recognition Methods:
- Dimensionality Reduction: Principal Component Analysis (PCA), Linear Discriminant Analysis (LDA)
- Classification Algorithms: Support Vector Machines (SVM), Artificial Neural Networks (ANN), Random Forests
Electronic Nose Experimental Workflow
The Scientist's Toolkit: Essential Research Reagents and Materials
Table 3: Key Research Reagent Solutions for VOC Analysis
| Item | Function | Application Examples |
|---|---|---|
| Alkanone Calibration Standards (C4-C9) | Retention index calibration for GC-IMS | Establishing compound retention times [31] |
| Internal Standards (deuterated compounds) | Quantification reference | Improving analytical precision in complex matrices |
| High-Purity Carrier Gases (N₂, synthetic air) | GC carrier & IMS drift gas | Maintaining system stability and sensitivity [31] |
| Reference Materials (authentic chemicals) | Compound identification | VOC verification and method validation [14] |
| Sensor Calibration Mixtures | E-nose sensor calibration | Establishing baseline responses [18] |
| Headspace Vials/Septa | Sample containment | Preventing contamination and VOC loss [5] |
| Solid Phase Microextraction Fibers | VOC pre-concentration | Enhancing sensitivity for trace compounds [14] |
Scaling Considerations and Deployment Strategies
Industrial Deployment Challenges and Solutions
Throughput Optimization:
- GC-IMS: Implement automated sample handlers and sequence optimization to maximize instrument utilization; typical analysis time of 20-50 minutes limits throughput to 20-30 samples daily [31] [14]
- E-nose: Deploy multiple inexpensive units for parallel processing; rapid analysis (1-5 minutes) enables throughput of 100+ samples daily [18] [19]
Data Management Solutions:
- GC-IMS: Requires sophisticated data processing software and reference libraries; cloud-based solutions facilitate multi-location data integration [77]
- E-nose: Employs machine learning algorithms that improve with expanded datasets; edge computing enables real-time analysis [18] [2]
Maintenance and Calibration:
- GC-IMS: Regular column maintenance, detector calibration, and gas system checks; scheduled downtime required [14]
- E-nose: Sensor drift compensation algorithms reduce recalibration frequency; modular design enables sensor replacement [77] [18]
Technology Selection Framework
Technology Selection Decision Framework
The strategic deployment of GC-IMS and E-nose technologies must align with specific application requirements and operational constraints. GC-IMS delivers superior analytical resolution for research applications requiring compound identification and mechanism elucidation, as demonstrated in studies profiling VOCs in sesame oil and star anise essential oils [31] [14]. The technology provides definitive chemical information but requires greater operational expertise and financial investment.
Conversely, E-nose systems offer practical advantages for industrial quality control environments where rapid classification, high throughput, and operational simplicity are prioritized. Successful implementations in edible oil adulteration detection and dairy spoilage monitoring highlight its utility for routine screening applications [12] [19].
Future developments in miniaturized GC-IMS systems and advanced sensor materials for E-nose are poised to narrow the performance gap between these technologies. Hybrid approaches that leverage E-nose for rapid screening followed by confirmatory GC-IMS analysis represent a powerful strategy for comprehensive quality assessment programs. The optimal deployment strategy acknowledges the complementary strengths of both technologies within an integrated analytical framework.
Head-to-Head Comparison: Validation Metrics and Strategic Technology Selection
Direct Comparison of Sensitivity, Selectivity, and Speed
Gas chromatography-ion mobility spectrometry (GC-IMS) and electronic nose (e-nose) technologies have emerged as powerful analytical tools for food quality assessment, offering distinct advantages and limitations in sensitivity, selectivity, and operational speed. As the demand for rapid, non-destructive food quality monitoring grows, researchers and industry professionals require clear guidance on selecting appropriate instrumentation for specific applications. This comparison guide provides an objective evaluation of GC-IMS and e-nose systems based on experimental data and technical specifications from recent scientific literature, framed within the context of food quality assessment research.
The fundamental operational principles of these technologies diverge significantly. GC-IMS combines the separation power of gas chromatography with the detection sensitivity of ion mobility spectrometry, generating two-dimensional data (retention time and drift time) for highly specific compound identification and quantification [78]. In contrast, e-nose systems employ an array of partially selective chemical sensors coupled with pattern recognition algorithms to generate composite "fingerprint" responses to complex odor profiles without necessarily identifying individual compounds [18]. This fundamental difference in approach directly influences their respective performance characteristics in practical applications.
Performance Comparison Table
Table 1: Direct comparison of GC-IMS and electronic nose performance characteristics
| Performance Metric | GC-IMS | Electronic Nose (E-Nose) |
|---|---|---|
| Sensitivity | Parts-per-billion (ppb) to parts-per-trillion (ppt) levels for many compounds [78] | Varies by sensor type; generally higher ppm to ppb range [18] |
| Selectivity | High (two-dimensional separation: GC retention time + IMS drift time) [78] | Moderate (array of partially selective sensors with pattern recognition) [18] |
| Analysis Speed | Minutes to tens of minutes (including separation) [14] | Seconds to minutes (direct headspace measurement) [18] |
| Identified Volatiles | 47 VOCs in roasted walnuts; 111 VOCs in Amomi Fructus [8] [79] | Fingerprint response without mandatory compound identification [80] |
| Quantitative Capability | Good (linear response for quantification) [78] | Limited (primarily qualitative classification) [18] |
| Sample Throughput | Lower (limited by GC cycle time) | Higher (rapid analysis enables high-volume screening) |
| Operational Complexity | Moderate (requires method development) | Low (often designed for ease of use) |
| Portability | Benchtop systems common; portable versions available [78] | High (many portable and handheld systems available) [18] |
Experimental Evidence and Performance Validation
Sensitivity in Practical Applications
In a comprehensive study comparing analytical techniques for star anise essential oil, GC-IMS demonstrated sufficient sensitivity to characterize volatile compounds extracted using four different methods (hydrodistillation, ethanol solvent extraction, supercritical CO2, and subcritical extraction). The technique successfully identified and distinguished subtle compositional differences between extraction methods, with researchers noting its particular advantage for detecting trace-level components [14]. This high sensitivity originates from the efficient ionization process in IMS, which enables detection at ultratrace concentration levels, typically in the ppb to ppt range for many volatile organic compounds (VOCs) [78].
E-nose systems exhibit variable sensitivity depending on the sensor technology employed. Chemiresistive metal oxide semiconductor (MOS) sensors and carbon nanotube (CNT) sensors offer high sensitivity but often remain in the ppm to ppb range [18]. While generally less sensitive than GC-IMS for specific compound detection, e-nose systems can be highly sensitive to changes in overall odor profiles, making them effective for spoilage detection and quality grading applications where specific compound identification is not required.
Selectivity and Compound Identification
The orthogonal separation in GC-IMS provides exceptional selectivity by combining GC retention time with IMS drift time, creating a two-dimensional fingerprint that enables confident identification of co-eluting compounds. In Amomi fructus analysis, GC-IMS identified 111 volatile compounds and successfully distinguished authentic samples from counterfeits based on specific marker compounds [8]. This high selectivity allows researchers to monitor individual compounds within complex food matrices, providing insights into specific quality parameters and degradation pathways.
E-nose systems offer moderate selectivity through sensor arrays containing multiple sensing elements with varying response profiles to different chemical classes. Pattern recognition algorithms then process these collective responses to distinguish samples. This approach proved effective in discriminating walnut samples at different roasting conditions, where the combined sensor response pattern rather than individual compound identification was sufficient for classification [79]. However, this method provides limited information about specific compounds responsible for observed differences.
Analysis Speed and Throughput
E-nose technology excels in analysis speed, providing results within seconds to minutes through direct headspace measurement without chromatographic separation. This rapid analysis enables high-throughput screening, making it suitable for real-time quality monitoring in industrial settings. In stress screening using sweat samples, e-nose analysis achieved 89% accuracy with significantly faster processing compared to GC-IMS [81].
GC-IMS requires additional time for chromatographic separation, typically resulting in analysis times of minutes to tens of minutes. Despite this longer cycle time, GC-IMS was still characterized as a "rapid" technique in star anise essential oil analysis, particularly when compared to traditional GC-MS methods [14]. The trade-off between analysis time and information content remains a key consideration for method selection.
Detailed Experimental Protocols
GC-IMS Protocol for Food Quality Assessment
Table 2: Typical GC-IMS parameters for food volatile compound analysis
| Parameter | Configuration | Purpose |
|---|---|---|
| Sample Introduction | Headspace (100 μL), 85°C, 5 min incubation | Volatile compound extraction and introduction |
| GC Column | FS-SE-54-CB-1 (15 m × 0.53 mm) | Primary separation of volatile compounds |
| Column Temperature | 40°C | Optimal compound separation |
| Carrier Gas | Nitrogen, 2-150 mL/min gradient | Mobile phase for chromatographic separation |
| Ionization Source | Tritium (β-emitter, 300 MBq) | Atmospheric pressure chemical ionization |
| Drift Gas | Nitrogen, 150 mL/min | Counter-flow gas for ion separation |
| IMS Temperature | 45°C | Stable ion mobility conditions |
| Detection | Faraday plate with digitization | Ion current measurement |
The general workflow for GC-IMS analysis involves: (1) sample preparation (often grinding or homogenization), (2) headspace incubation at controlled temperature, (3) automated headspace injection, (4) chromatographic separation, (5) ionization, (6) ion separation in drift tube, and (7) detection [14] [78]. Data analysis typically includes generating VOC fingerprints, identifying compounds through comparison with standards, and applying multivariate statistics for pattern recognition and classification.
Electronic Nose Protocol for Food Quality Assessment
Table 3: Typical E-nose parameters for food quality screening
| Parameter | Configuration | Purpose |
|---|---|---|
| Sample Volume | 2 mL in 40 mL headspace vial | Sufficient headspace generation |
| Equilibration | 50 min at 20°C | Consistent volatile profile development |
| Sensor Array | 10 metal oxide semiconductors | Broad-spectrum volatile detection |
| Flush Time | 80 s | System cleaning between samples |
| Measurement Time | 100 s | Stable sensor response acquisition |
| Chamber Flow | 450 mL/min | Constant vapor presentation to sensors |
| Data Acquisition | Sensor response curves recording | Pattern development for recognition |
Standard e-nose protocol includes: (1) standardized sample preparation, (2) headspace equilibration under controlled conditions, (3) automated sampling, (4) sensor array response measurement, (5) signal preprocessing (baseline correction, normalization), and (6) pattern recognition using multivariate statistics or machine learning algorithms [14] [18]. The method emphasizes consistency in sample presentation and environmental conditions to ensure reproducible results.
Technology Workflow Diagrams
Essential Research Reagent Solutions
Table 4: Key materials and reagents for GC-IMS and E-nose experiments
| Item | Function | Application Examples |
|---|---|---|
| Headspace Vials | Contain sample during volatile equilibration | Standardized volume (20-40 mL) with PTFE/silicone septa [79] |
| Internal Standards | Quantification reference & signal normalization | Deuterated compounds or stable isotopes for GC-IMS [78] |
| Alkane Standard Mixture | Retention index calibration for compound identification | GC retention time standardization across systems [79] |
| Sensor Array | Volatile compound detection | MOS, CP, QCM, or SAW sensors for e-nose [18] |
| Solid-Phase Microextraction (SPME) Fibers | Volatile pre-concentration for enhanced sensitivity | 65 μm PDMS/DVB coating for broad VOC range [14] |
| Drift Gas | Ion separation medium in IMS drift tube | High-purity nitrogen (99.99%) for stable mobility conditions [78] |
| Carrier Gas | Mobile phase for chromatographic separation | High-purity nitrogen or helium for GC separation [14] |
| Chemical Standards | Compound identification and method validation | Pure VOC standards for creating reference libraries [10] |
GC-IMS and electronic nose technologies offer complementary strengths for food quality assessment applications. GC-IMS provides superior sensitivity (ppb-ppt range), high selectivity through two-dimensional separation, and detailed compound identification capabilities, making it ideal for targeted analysis and method development. Electronic nose systems offer significantly faster analysis times (seconds-minutes), higher sample throughput, and greater operational simplicity, making them suitable for rapid screening and quality grading applications.
The choice between these technologies depends fundamentally on the specific research or quality control objectives. For applications requiring comprehensive volatile profiling and specific compound quantification, GC-IMS is the preferred option. For rapid classification, quality grading, and high-throughput screening where specific compound identification is not essential, electronic nose systems provide an efficient and effective solution. Emerging approaches involving data fusion from both technologies demonstrate promising potential for enhanced classification accuracy and comprehensive quality assessment [8].
Benchmarking Against Traditional Methods like GC-MS
In food quality and safety research, the analysis of volatile organic compounds (VOCs) serves as a critical indicator of product authenticity, freshness, and overall sensory characteristics. For decades, gas chromatography-mass spectrometry (GC-MS) has stood as the undisputed reference method for VOC analysis, providing exceptional qualitative and quantitative capabilities with high sensitivity and robust compound identification through mass spectral libraries [10] [82]. However, the evolving demands of modern food science—emphasizing rapid, high-throughput, and non-destructive analysis—have driven the development and adoption of two complementary technologies: gas chromatography-ion mobility spectrometry (GC-IMS) and electronic nose (E-nose) systems [18] [82]. This comparison guide objectively benchmarks GC-IMS and E-nose against traditional GC-MS, examining their respective performances, applications, and limitations within food quality assessment research.
The fundamental distinction between these technologies lies in their analytical approach. While GC-MS provides detailed compound separation and identification, GC-IMS offers rapid visualization of volatile fingerprints, and E-nose delivers pattern-based odor classification without compound separation [10] [82]. Understanding their complementary strengths enables researchers to select appropriate methodologies for specific applications, from fundamental research to industrial quality control.
Performance Benchmarking: Comparative Analysis of Three Analytical Platforms
Analytical Capabilities and Performance Metrics
Table 1: Technical Specifications and Performance Comparison of GC-MS, GC-IMS, and E-Nose
| Parameter | GC-MS | GC-IMS | E-Nose |
|---|---|---|---|
| Detection Principle | Separation + mass fragmentation | Separation + drift time measurement | Cross-reactive sensor array |
| Analysis Speed | 30-60 minutes | 10-20 minutes | 1-5 minutes |
| Sensitivity | ppb-ppt level | ppb level | ppm-ppb level |
| Identification Capability | High (Library matching) | Moderate (IMS & GC libraries) | None (Pattern recognition only) |
| Quantitative Ability | Excellent | Good | Limited (Relative comparison) |
| Sample Throughput | Low | Medium | High |
| Portability | Low (Benchtop) | Medium (Some portable units) | High |
| Operational Cost | High | Medium | Low |
| Data Output | Compound identification & concentration | VOC fingerprints & relative quantification | Odor patterns & classification |
GC-MS systems separate complex mixtures using gas chromatography and identify individual compounds through their unique mass fragmentation patterns, providing both qualitative and quantitative data with high confidence [10]. This technology boasts a wide linear dynamic range and excellent sensitivity, capable of detecting compounds at parts-per-trillion levels in some configurations. The availability of extensive mass spectral libraries enables identification of thousands of volatile compounds, making GC-MS particularly valuable for discovering novel flavor compounds or detecting unexpected contaminants [82].
GC-IMS combines the separation power of GC with the rapid detection capability of IMS, separating ions based on their size, shape, and charge under an electric field at atmospheric pressure [82]. While offering slightly reduced sensitivity compared to GC-MS (typically parts-per-billion level), GC-IMS provides significantly faster analysis times and requires no vacuum system, potentially enabling more compact instrumentation [53] [82]. The technique excels in visualizing complex VOC fingerprints and detecting subtle changes in volatile profiles, though its compound identification reliability depends on the availability of IMS and GC libraries [28].
E-nose systems employ an array of non-specific chemical sensors that respond to broad classes of volatile compounds, generating unique response patterns for different odors [18]. While lacking compound identification capabilities and having relatively lower sensitivity (typically parts-per-million to parts-per-billion), E-noses provide the fastest analysis and can be highly portable for field applications [2]. Their strength lies in rapid classification and quality grading rather than compositional analysis [83].
Operational Characteristics and Practical Considerations
Table 2: Operational Requirements and Application Suitability
| Characteristic | GC-MS | GC-IMS | E-Nose |
|---|---|---|---|
| Sample Preparation | Often extensive | Minimal | Minimal to none |
| Pretreatment Requirements | Often required (SPME, SBSE) | Direct headspace injection | Direct headspace measurement |
| Carrier Gas Requirements | High-purity helium or hydrogen | Nitrogen or purified air | Synthetic or filtered air |
| Operator Expertise | High | Medium | Low |
| Method Development Complexity | High | Medium | Low |
| Multi-sample Classification | With chemometrics | Built-in data comparison | Native capability |
| Real-time Monitoring | Not suitable | Possible | Excellent |
| Capital Investment | High ($50,000-$150,000+) | Moderate ($30,000-$80,000) | Low ($5,000-$40,000) |
The operational requirements for these technologies vary significantly, impacting their suitability for different laboratory environments and applications. GC-MS typically demands extensive sample preparation techniques such as solid-phase microextraction (SPME) or stir bar sorptive extraction (SBSE) to preconcentrate analytes, along with high-purity carrier gases and significant operator expertise for method development and data interpretation [14] [10]. The substantial capital investment and operational costs position GC-MS primarily in research and reference laboratories.
GC-IMS simplifies sample preparation, often requiring only direct headspace injection, and utilizes nitrogen or purified air as drift and carrier gases, reducing operational costs [82]. The technique offers quicker method development and requires less specialized operator training compared to GC-MS, making it accessible for quality control laboratories [65].
E-nose systems provide the simplest operation with minimal sample preparation and no consumables beyond carrier gas in some configurations [18] [5]. Their ease of use and rapid analysis make them suitable for non-specialist operators in production environments for at-line or online monitoring applications [2].
Application-Based Performance in Food Analysis
Table 3: Performance Metrics in Specific Food Applications
| Application | Technology | Classification Accuracy | Key Advantages | Reference |
|---|---|---|---|---|
| Essential Oil Authentication | GC-MS | >95% (Compound identification) | Definitive chemical composition | [14] |
| GC-IMS | ~98% (Origin discrimination) | Faster analysis, good sensitivity | [14] | |
| E-nose | ~90% (Pattern recognition) | Rapid screening | [14] | |
| Fish Freshness Assessment | GC-MS | >95% (VOC profiling) | Identification of specific spoilage markers | [53] [28] |
| GC-IMS | ~95% (Freshness classification) | Rapid fingerprinting | [53] [28] | |
| E-nose | ~92% (Spoilage detection) | Ultra-fast assessment | [28] [83] | |
| Herbal Medicine Authentication | GC-MS | >97% (Chemical profiling) | Comprehensive metabolite coverage | [65] |
| GC-IMS | ~98% (Origin verification) | High-throughput screening | [65] | |
| E-nose | ~95% (Rapid authentication) | Minimal sample preparation | [65] | |
| Dairy Product Quality | GC-MS | >95% (Flavor compound analysis) | Quantitative analysis of key aromas | [5] |
| GC-IMS | ~93% (Batch-to-batch variation) | Monitoring process changes | [5] | |
| E-nose | ~90% (Quality grading) | Real-time monitoring capability | [5] |
In practical applications, each technology demonstrates distinct strengths depending on the analytical requirements. For essential oil authentication, a comparative study on star anise essential oils found that GC-IMS provided accuracy comparable to GC-MS for distinguishing extraction methods while offering significantly faster analysis [14]. The research concluded that GC-IMS was the most suitable method when considering both accuracy and rapidity [14].
For fish freshness assessment, GC-MS identified specific spoilage markers such as alcohols, ketones, and aldehydes with high precision, while GC-IMS and E-nose provided comparable classification accuracy with faster results [53] [28]. In a study on fermented golden pomfret, all three techniques successfully differentiated cooking methods, with GC-MS providing compound identification while GC-IMS and E-nose offered rapid classification [28].
In herbal medicine authentication, GC-IMS demonstrated exceptional performance (98% accuracy) when combined with pattern recognition for distinguishing authentic Amomi Fructus from counterfeits, rivaling the capabilities of GC-MS while offering higher throughput [65]. Data-level fusion of E-nose and GC-IMS further improved accuracy to 97.96%, outperforming single-technology approaches [65].
Experimental Protocols: Methodologies for Cross-Technology Comparison
Standardized Workflow for Technology Benchmarking
Comparative Analysis Workflow
Detailed Methodological Protocols
Sample Preparation Protocol
For comparative studies, consistent sample preparation is essential across all platforms. For solid food samples (meat, fish, herbs), homogenization is typically performed using a commercial blender to ensure particle size uniformity [14] [28]. Precisely 2.0 g ± 0.1 g of homogenized sample is weighed into separate headspace vials (20 mL for GC-IMS/E-nose; 40 mL for GC-MS) [28] [5]. Samples are then incubated at specific temperatures optimized for each technology: 40°C for E-nose, 60°C for GC-IMS, and 70°C for GC-MS SPME analysis [14] [28] [5]. Incubation times are similarly standardized: 30 minutes for E-nose, 10-15 minutes for GC-IMS, and 40-60 minutes for GC-MS SPME extraction [28] [5].
GC-MS Analysis Protocol
GC-MS analysis typically employs instruments such as Agilent 7890A/5977B systems with HP-5MS capillary columns (60 m × 0.25 mm × 0.25 μm) [14]. The carrier gas is high-purity helium (≥99.999%) at a flow rate of 1 mL/min [14]. The temperature program commonly starts at 50°C (held for 3 minutes), ramped to 180°C at 2°C/min, then to 300°C at 20°C/min (held for 10 minutes) [14]. The injector temperature is maintained at 250°C with a split ratio of 120:1 [14]. Mass spectrometry parameters include: electron ionization (EI) source at 70 eV, ion source temperature of 230°C, and mass scan range of 29-550 m/z [14]. For sample introduction, SPME fibers (65 μm PDMS/DVB) are exposed to the headspace for optimal extraction efficiency [14].
GC-IMS Analysis Protocol
GC-IMS analysis utilizes instruments such as the FlavourSpec from G.A.S. equipped with FS-SE-54-CB-1 columns (15 m × 0.53 mm) [14]. The injection volume is typically 100-500 μL in splitless mode at injection temperatures of 80-85°C [14] [28]. The column temperature is maintained at 40-60°C [14] [5]. The carrier gas is nitrogen (≥99.999%) with a flow rate program: initial 2 mL/min for 2 minutes, increased to 10-20 mL/min over 8-10 minutes, then to 100 mL/min over 10 minutes, and finally to 150 mL/min for 5-10 minutes [14] [5]. IMS conditions include a drift tube temperature of 45°C, drift gas flow (N₂) of 150 mL/min, and ionization source using tritium (β-rays) [14] [28].
E-Nose Analysis Protocol
E-nose analysis commonly employs PEN3 systems (Airsense Analytics) with ten metal oxide sensors [14] [5]. Sample measurement utilizes 2-5 g of sample in 20-40 mL headspace vials with equilibration at 20-40°C for 30-50 minutes [14] [5]. Instrument parameters include: injection flow rate of 300-400 mL/min, measurement time of 100-200 seconds, and cleaning time of 120-300 seconds between samples [14] [28]. Sensor response data is typically collected at 1-second intervals, with stable values from the latter portion of the measurement period used for analysis [5].
Data Processing and Statistical Analysis
For cross-technology comparison, consistent statistical approaches are essential. Principal Component Analysis (PCA) is universally applied to all datasets to visualize sample clustering and identify outliers [14] [65]. Linear Discriminant Analysis (LDA) is employed for classification models and accuracy calculation [14] [18]. For GC-MS and GC-IMS data, Partial Least Squares-Discriminant Analysis (PLS-DA) and Orthogonal PLS-DA (OPLS-DA) are used to identify marker compounds with Variable Importance in Projection (VIP) scores >1.0 considered significant [65] [28]. All analyses are typically performed with cross-validation (leave-one-out or k-fold) to ensure model robustness, with accuracy calculated as (number of correct predictions/total samples) × 100% [65].
Technology Selection Framework
Technology Selection Decision Tree
Essential Research Reagent Solutions and Materials
Table 4: Key Research Reagents and Materials for Cross-Technology Studies
| Category | Specific Items | Application Function | Technology Compatibility |
|---|---|---|---|
| Reference Standards | n-Alkane series (C5-C32) | Retention index calibration | GC-MS, GC-IMS |
| 2,4,6-Trimethylpyridine | Internal standard for quantification | GC-MS, GC-IMS | |
| Target analyte standards | Compound identification/verification | GC-MS, GC-IMS | |
| Sample Preparation | SPME fibers (PDMS/DVB/CAR) | VOC extraction/enrichment | Primarily GC-MS |
| Headspace vials (20-40 mL) | Sample containment/equilibration | All three technologies | |
| HPLC-grade solvents | System cleaning/sample extraction | GC-MS, GC-IMS | |
| Consumables | High-purity carrier gases (He, N₂) | Mobile phase for separation | GC-MS, GC-IMS |
| Zero air/synthetic air | Sensor baseline/purging | E-nose, GC-IMS | |
| Certified reference materials | Method validation/quality control | All three technologies | |
| Data Analysis | Mass spectral libraries | Compound identification | GC-MS |
| IMS databases | Compound verification | GC-IMS | |
| Chemometrics software | Pattern recognition/classification | All three technologies |
The benchmarking analysis demonstrates that GC-MS, GC-IMS, and E-nose technologies offer complementary rather than competing capabilities for food quality assessment. GC-MS remains indispensable for comprehensive volatile profiling, definitive compound identification, and absolute quantification, particularly in research applications requiring detailed chemical characterization [10] [82]. GC-IMS emerges as a powerful compromise, providing detailed fingerprinting capabilities with significantly faster analysis times than GC-MS, making it ideal for quality control laboratories requiring more detailed information than simple classification [14] [65]. E-nose systems excel in rapid screening applications, product grading, and real-time monitoring where speed and simplicity are prioritized over compositional data [18] [2].
The integration of multiple technologies through data fusion approaches represents the most powerful application of these platforms, as demonstrated by studies achieving up to 97.96% classification accuracy when combining GC-IMS and E-nose data [65]. For research requiring both comprehensive compound identification and high-throughput analysis, a tiered approach utilizing E-nose for rapid screening followed by GC-IMS or GC-MS for detailed investigation of samples of interest provides an optimal balance of efficiency and analytical depth.
Technology selection should be guided by specific application requirements: GC-MS for discovery and method development, GC-IMS for quality control and authentication, and E-nose for at-line monitoring and rapid screening. As these technologies continue to evolve, further convergence of their capabilities—particularly through miniaturization, enhanced sensitivity, and intelligent data fusion—will likely expand their applications across the food quality assessment landscape.
In the field of food quality assessment, analytical techniques like Gas Chromatography-Ion Mobility Spectrometry (GC-IMS) and electronic nose (E-nose) systems generate complex, high-dimensional data that require sophisticated chemometric tools for interpretation. The performance of pattern recognition models—including Principal Component Analysis (PCA), Linear Discriminant Analysis (LDA), Artificial Neural Networks (ANN), and Support Vector Machines (SVM)—must be rigorously validated using appropriate statistical metrics to ensure analytical reliability. These models are essential for transforming instrumental responses into actionable insights about food authenticity, freshness, and optimal processing conditions. For researchers and scientists, particularly in drug development and food chemistry, understanding these validation metrics is crucial for selecting the optimal model for specific applications, especially when comparing the complementary strengths of detailed separation techniques like GC-IMS against rapid sensor-based systems like E-nose.
The fundamental challenge in model evaluation lies in balancing performance with generalizability. As demonstrated in food authentication studies, high-dimensional analytical datasets often feature strong multicollinearity, limited sample sizes, and class imbalances, creating conditions where models can easily overfit without proper validation protocols [84]. This guide systematically compares the validation metrics and performance characteristics of PCA, LDA, ANN, and SVM within the specific context of food quality assessment, providing a framework for objective model selection.
Core Analytical Techniques and Their Validation Frameworks
Principal Component Analysis (PCA)
Purpose and Mechanism: PCA is an unsupervised dimensionality reduction technique that transforms correlated variables into a new set of uncorrelated variables called principal components, which capture maximum variance in the data [85]. It operates through eigendecomposition of the covariance matrix, extracting orthogonal components as linear combinations of original variables [84]. In food quality studies, PCA serves primarily as an exploratory tool for visualizing clustering tendencies, identifying outliers, and revealing latent structures in sensory or instrumental data before supervised modeling [86].
Interpretation of Results: PCA provides two key elements: scores (indicating sample locations) and loadings (showing variable importance) [86]. The loadings indicate which variables contribute most significantly to the observed trends and group separations. For validation, the proportion of variance explained by each principal component is calculated as the ratio of its eigenvalue to the sum of all eigenvalues [85]. In practice, the number of components to retain is often determined by examining a scree plot to identify the "elbow point" where explained variance plateaus [85].
Typical Workflow:
- Standardize the data by subtracting the mean and dividing by the standard deviation
- Compute the covariance matrix of the standardized data
- Perform eigendecomposition to obtain eigenvectors and eigenvalues
- Sort eigenvectors by descending eigenvalues
- Select top-k eigenvectors to form principal components [85]
Linear Discriminant Analysis (LDA)
Purpose and Mechanism: LDA is a supervised classification technique that seeks linear combinations of predictors maximizing between-group separation while minimizing within-group variance [84]. Mathematically, LDA solves the generalized eigenvalue problem (SB)w = λ(SW)w, where SB and SW represent between-class and within-class scatter matrices, respectively [84]. This formulation requires S_W to be invertible, which can be problematic with high-dimensional or highly correlated data—a common scenario in spectroscopic food analysis [84].
Performance Metrics and Limitations: Model performance is typically assessed through accuracy, sensitivity, specificity, balanced accuracy (critical for unbalanced classes), and Cohen's Kappa (accounting for chance agreement) [84]. A comparative study on apple origin authentication found LDA provided higher robustness and interpretability in small, unbalanced datasets compared to PLS-DA [84]. However, LDA's performance can decrease with non-homoscedastic or non-Gaussian data, leading to the development of subclass discriminant approaches for miniature spectrometer-based food analysis [87].
Artificial Neural Networks (ANN)
Purpose and Mechanism: ANNs, particularly Backpropagation Artificial Neural Networks (BP-ANN), are computational models that learn complex nonlinear relationships through interconnected layers of nodes. In food quality analysis, ANN has demonstrated remarkable efficacy due to strong generalization ability and capacity for large-scale data training [79]. The backpropagation algorithm adjusts connection weights to minimize differences between actual and predicted outputs.
Validation Metrics: For quantitative prediction tasks (e.g., predicting volatile compound concentrations), ANN performance is typically reported using R² (coefficient of determination), RMSE (root mean square error), and accuracy rates [79] [88]. In a comprehensive study analyzing volatile organic compounds (VOCs) in roasted in-shell walnut kernels, a BP-ANN model demonstrated high accuracy (0.9448) in predicting VOC concentrations, successfully integrating data from E-nose, HS-GC-IMS, and HS-SPME-GC-MS techniques [79].
Support Vector Machines (SVM)
Purpose and Mechanism: SVM is a supervised learning algorithm that finds optimal hyperplanes to separate different classes in high-dimensional feature space. SVM can handle nonlinear decision boundaries through kernel functions that map data to higher dimensions [89]. This makes SVM particularly valuable for classifying complex spectral patterns in food analysis.
Performance Assessment: SVM performance is evaluated using accuracy, precision, recall, F1-score, and ROC-AUC [88]. In NIRS-based food discrimination, SVM combined with appropriate feature extraction methods has achieved excellent classification performance. One study on hyperspectral imaging achieved 98.29% accuracy in prediction sets using SVM with a reduced set of wavelengths [89]. However, performance depends heavily on proper kernel selection and parameter tuning.
Table 1: Summary of Model Performance in Food Quality Applications
| Model | Primary Function | Key Validation Metrics | Reported Performance in Food Studies | Data Requirements |
|---|---|---|---|---|
| PCA | Dimensionality reduction, exploratory analysis | Proportion of variance explained, scree plot | >90% variance accounted for in fermented food sensory analysis [90] | No training labels needed |
| LDA | Supervised classification | Accuracy, sensitivity, specificity, Cohen's Kappa | High robustness in small, unbalanced apple authentication datasets [84] | Requires labeled data; performs best with balanced classes |
| ANN | Nonlinear prediction, pattern recognition | R², RMSE, accuracy rate | 94.48% accuracy predicting VOC concentrations in walnuts [79] | Large datasets for optimal performance |
| SVM | Classification, regression | Accuracy, precision, F1-score, ROC-AUC | 98.29% accuracy in NIR hyperspectral imaging classification [89] | Moderate to large datasets; sensitive to parameter tuning |
Experimental Protocols for Model Validation
Comparative Evaluation Framework for Discriminant Models
A rigorous approach for comparing LDA and PLS-DA algorithms in food authentication studies provides a validated experimental protocol [84]:
Dataset Preparation: The study used 28 apple samples from four geographical regions characterized by 19 features (18 minerals plus ¹⁰B/¹¹B isotope ratio), creating an observation-to-feature ratio of 1.47—below the threshold for conventional LDA estimation.
Data Preprocessing: Apply normalization, scaling, and transformation to address multicollinearity and class imbalance (4-13 samples per geographic origin).
Dimensionality Reduction: Compare two philosophies: (1) explicit feature selection via PCA followed by LDA projection versus (2) implicit dimension reduction through PLS-DA's latent variable extraction.
Model Validation: Employ leave-one-out cross-validation to assess performance and stability, particularly crucial for small sample sizes.
Comprehensive Metric Evaluation: Assess models using accuracy, sensitivity, specificity, balanced accuracy (critical for unbalanced classes), detection prevalence, and Cohen's Kappa (accounting for chance agreement) [84].
Integrated Analytical Approach for VOC Prediction
Research on roasted in-shell walnut kernels demonstrates a protocol for combining multiple analytical techniques with machine learning [79]:
Multi-Instrument Data Collection: Analyze samples using Quantitative Descriptive Analysis (QDA), E-nose, HS-SPME-GC-MS, and HS-GC-IMS to comprehensively characterize aroma profiles and volatile compounds.
Optimal Processing Determination: Identify optimal processing conditions (e.g., roasting at 140°C for 60 minutes for walnuts) by evaluating aromatic compound release across different conditions.
Volatile Compound Identification: Detect and identify volatile organic compounds (VOCs) across techniques—76 VOCs via HS-SPME-GC-MS and 47 VOCs via HS-GC-IMS—with 26 compounds detected by both methods.
Marker VOC Selection: Use multivariate statistical analysis to identify marker VOCs for different processing conditions (e.g., 1-Propanethiol, Ethanol, 2-Butanone for different roasting times; 2-Methylpropanal, 1-Hexanal for different temperatures).
ANN Model Development and Validation: Train BP-ANN models on instrumental data to predict VOC concentrations, reporting prediction accuracy (0.9448 in the walnut study) [79].
Comparative Performance in Food Quality Applications
Geographical Origin Authentication
In food origin authentication, the combination of PCA for feature extraction followed by supervised classification has proven effective. A study on apple origin discrimination using mineral profiles compared PCA-LDA and PLS-DA approaches [84]. The results demonstrated that LDA provided higher robustness and interpretability in small, unbalanced datasets, while PLS-DA exhibited higher apparent sensitivity but lower reproducibility under similar conditions. This highlights how dataset characteristics significantly influence optimal model selection.
Volatile Compound Analysis and Process Optimization
Research on roasting effects on walnut kernels demonstrates the complementary nature of multiple analytical approaches. The study successfully used E-nose, GC-IMS, and GC-MS to distinguish samples under different roasting conditions, then employed BP-ANN to predict VOC concentrations with high accuracy [79]. This integrated approach showcases how different models serve distinct purposes: PCA and related techniques for discrimination and visualization, followed by ANN for quantitative prediction of complex nonlinear relationships between processing parameters and chemical profiles.
Spectroscopy-Based Quality Control
In NIRS applications for food quality, the combination of feature extraction methods with shallow learning machines effectively addresses the "curse of dimensionality" [89]. PCA is widely used for dimensionality reduction of spectral data, after which classifiers like PLS-DA and SVM achieve classification. Studies comparing these approaches found that SVM often outperforms PLS-DA in classification accuracy, with one study reporting 98.29% accuracy for SVM versus 99.00% for PLS-DA in hyperspectral imaging applications [89].
Table 2: Model Selection Guide for Food Quality Applications
| Application Scenario | Recommended Models | Rationale | Expected Performance Range |
|---|---|---|---|
| Exploratory data analysis | PCA | Identifies natural clustering, outliers, and correlations without prior assumptions | >90% variance explained with 2-3 components common [90] |
| Small, unbalanced datasets | LDA | Higher robustness and interpretability in constrained data conditions [84] | Balanced accuracy >80% in authentication studies [84] |
| Nonlinear prediction tasks | ANN (BP-ANN) | Captures complex relationships between processing parameters and quality outcomes [79] | Accuracy >94% in VOC prediction [79] |
| Spectral classification | SVM with PCA | Handles high-dimensional data with strong generalization capability [89] | Accuracy >98% in NIRS applications [89] |
| Integrated analysis (multi-instrument) | ANN with data fusion | Effectively integrates heterogeneous data sources from multiple analytical platforms [79] | Accuracy >94% demonstrated with E-nose, GC-IMS, GC-MS data [79] |
Visualization of Analytical Workflows
Essential Research Reagents and Materials
Table 3: Key Research Reagents and Analytical Tools for Food Quality Studies
| Reagent/Equipment | Specification/Function | Application Example |
|---|---|---|
| Internal Standards | Chromatographic-grade compounds (e.g., n-decyl alcohol) for quantitative VOC analysis [79] | Enables precise quantification of volatile compounds in GC-IMS and GC-MS |
| Standard Reference Materials | Certified elements/minerals for calibration of spectroscopic instruments [84] | Ensures accuracy in elemental analysis for geographical origin authentication |
| Headspace Vials | 20mL vials with PTFE/silicone septa for volatile compound analysis [79] | Standardized containment for sample heating and volatile capture in GC-IMS/GC-MS |
| Chemical Standards | Pure volatile compounds (e.g., hexanal, octanal, 2-pentylfuran) for identification [79] | Peak identification and method validation in chromatographic analyses |
| E-nose Sensor Arrays | Metal Oxide Semiconductor (MOS), Quartz Crystal Microbalances (QCMs), Conducting Organic Polymers (COPs) [2] | Pattern-based detection of volatile profiles for rapid quality screening |
| ICP-MS Instruments | High-precision elemental analysis (e.g., Agilent 7900) for mineral profiling [84] | Detection of trace elements for geographical authentication of food samples |
| Near-Infrared Spectrometers | Portable devices for non-destructive quality testing [89] | Rapid screening of composition and authenticity in various food matrices |
The selection and validation of chemometric models for food quality assessment requires careful consideration of both analytical objectives and dataset characteristics. PCA remains indispensable for exploratory analysis and dimensionality reduction, particularly when dealing with highly correlated variables from techniques like GC-IMS and E-nose. For classification tasks, LDA offers robustness in small, unbalanced datasets typical of geographical authentication studies, while SVM excels in high-dimensional spectral classification. ANN demonstrates superior capability for predicting complex nonlinear relationships, such as those between processing parameters and volatile compound formation.
Validation metrics must be aligned with specific analytical goals: variance explained for exploratory analysis, balanced accuracy and Cohen's Kappa for classification with imbalanced data, and R² and RMSE for prediction tasks. The integration of multiple analytical techniques—combining the separation power of GC-IMS with the rapid screening capability of E-nose—coupled with appropriate model selection provides the most comprehensive approach to food quality assessment. As food authentication challenges grow more sophisticated, the rigorous interpretation of these validation metrics will remain essential for research credibility and practical application in both academic and industrial settings.
In the field of food quality assessment and scientific research, the demand for rapid, accurate, and comprehensive analytical techniques has never been greater. Gas Chromatography-Ion Mobility Spectrometry (GC-IMS) and Electronic Nose (E-Nose) represent two powerful yet fundamentally different approaches to volatile organic compound (VOC) analysis. While both techniques target odor profiles, their operating principles, capabilities, and applications exhibit significant distinctions that researchers must consider when designing analytical workflows.
GC-IMS combines the separation power of gas chromatography with the detection sensitivity of ion mobility spectrometry, providing detailed information on volatile compound composition [91]. It offers high sensitivity, operates at atmospheric pressure, and can generate fingerprint patterns without complex sample preparation [92]. In contrast, E-Nose technology employs an array of non-specific chemical sensors with partial selectivity, mimicking the mammalian olfactory system to provide pattern-based recognition of complex odors without necessarily identifying individual compounds [19] [93].
This comparison guide examines the technical capabilities, performance characteristics, and complementary strengths of these two technologies, with particular emphasis on how their integration through data fusion strategies creates synergistic effects that enhance analytical outcomes across various research applications.
Technology Comparison: Fundamental Principles and Capabilities
Core Operating Mechanisms
GC-IMS Technology separates volatile compounds in two dimensions: first by chromatographic retention time in a capillary column, and then by ion mobility drift time in a drift tube under an electric field [91]. This dual separation mechanism enables excellent resolution of complex mixtures, including isobaric and isomeric compounds that are challenging to distinguish with other techniques. The output includes identification of individual volatile compounds based on both retention index and drift time, with collision cross section (CCS) values providing additional structural information for compound identification [91].
E-Nose Systems typically employ an array of different metal oxide semiconductor (MOS) sensors that change electrical conductivity when exposed to volatile compounds [19] [93]. Each sensor has broad and partially overlapping sensitivity profiles, creating a unique response pattern or "fingerprint" for different odor profiles. This pattern-based approach mirrors biological olfaction, where recognition occurs without necessarily identifying individual components in complex mixtures [93]. The technology is characterized by rapid analysis times, simplicity of operation, and portability for field applications.
Performance Characteristics and Limitations
Table 1: Technical Comparison of GC-IMS and E-Nose Technologies
| Parameter | GC-IMS | E-Nose |
|---|---|---|
| Separation Power | Two-dimensional separation (GC + IMS) | No compound separation |
| Compound Identification | Identifies individual VOCs | Pattern-based recognition |
| Sensitivity | High (μg/L to ng/L range) | Moderate to high |
| Analysis Time | 10-30 minutes | 1-5 minutes |
| Sample Preparation | Minimal required | Minimal required |
| Data Output | Spectral fingerprints + compound identification | Response pattern fingerprint |
| Isomer Differentiation | Excellent | Limited |
| Quantification Capability | Good | Semi-quantitative |
| Portability | Benchtop systems available | Excellent (handheld units available) |
GC-IMS limitations include potentially longer analysis times compared to E-Nose and generally more complex data interpretation requiring specialist knowledge [92] [91]. E-Nose limitations primarily revolve around the inability to identify specific compounds, sensitivity to environmental factors (humidity, temperature), and the potential for sensor drift over time, necessitating frequent calibration [19] [93].
Experimental Performance Data and Application Case Studies
Direct Performance Comparison in Food Analysis
Research studies directly comparing both technologies provide valuable insights into their relative performance across different applications:
Table 2: Experimental Performance Comparison in Various Applications
| Application | GC-IMS Performance | E-Nose Performance | Reference |
|---|---|---|---|
| Olive Oil Category Classification | 75-89.6% correct classification (HS-GC-IMS) | 77.8-86.7% correct classification (FGC E-nose) | [75] |
| Freshwater Fish Discrimination | 20 volatile compounds identified; successful differentiation of 4 fish species | Successful differentiation of 4 fish species via pattern recognition | [53] |
| Amomi Fructus Authenticity | 111 VOCs detected; 101 tentatively identified; 47 markers for authenticity | High accuracy in differentiation models; enhanced via data fusion | [8] |
| Wasabi Quality Control | 65 volatile components identified; 33 key markers for gas-producing vs normal wasabi | Successful discrimination between normal and gas-producing wasabi | [94] |
| Antrodia cinnamomea Cultivation | 75 volatile compounds detected; 41 characteristic markers for cultivation methods | Distinct flavor profiles distinguished among three culture methods | [92] |
Detailed Experimental Protocols
Protocol 1: GC-IMS Analysis of Amomi Fructus (as described in Frontiers Study)
- Sample Preparation: 75 batches of Amomi Fructus and counterfeits pulverized and sieved through No. 3 sieve
- HS-GC-IMS Parameters:
- Incubation: 40°C for 30 minutes
- Column: MXT-5 capillary column (15 m × 0.53 mm × 1.0 μm)
- Column temperature: 60°C
- Drift gas: Nitrogen (99.999% purity)
- Analysis time: Approximately 20-30 minutes
- Data Analysis: OPLS-DA with VIP >1 and p<0.05 for marker identification [8]
Protocol 2: E-Nose Analysis of Infant Formula (as described in Foods Journal)
- Instrument: PEN3 E-Nose (Airsense Analytics) with 10 metal oxide sensors
- Sample Preparation: 8.0 mL sample in 20 mL headspace vial
- Analysis Parameters:
- Incubation: 40°C ± 2°C for 300 s at 960 rpm
- Detection time: 200 s
- Injection flow rate: 300 mL/min
- Cleaning time: 300 s between samples
- Data Processing: Win Muster software with PCA and pattern recognition [5]
Protocol 3: Combined Workflow for Wasabi Analysis (as described in Analytical Methods)
- Sample Preparation: Normal and gas-producing wasabi samples analyzed in parallel
- Sequential Analysis:
- E-Nose and E-Tongue screening for initial classification
- HS-GC-MS and HS-GC-IMS for detailed volatile characterization
- Multivariate statistical analysis (VIP analysis) to identify key markers
- Integration: Four technique results combined to provide comprehensive flavor assessment [94]
Figure 1: Integrated GC-IMS and E-Nose Data Fusion Workflow
Data Fusion Strategies and Enhanced Performance
Data Fusion Approaches and Implementation
The integration of GC-IMS and E-Nose data can be implemented at different levels, each offering distinct advantages:
Low-Level Fusion involves the direct concatenation of raw or preprocessed data from both instruments before model building. This approach preserves all original information but requires careful data scaling and alignment due to the different nature of the data streams [75].
Mid-Level Fusion involves extracting features from each data source independently, then combining these features into a unified dataset for analysis. This method allows for optimized feature selection from each technique and has demonstrated superior performance in classification tasks [75].
Decision-Level Fusion processes data from each instrument separately through independent models, with the final classification based on combined outputs from both models. This approach offers robustness as the failure of one system doesn't compromise the entire analysis.
Documented Performance Enhancements
Empirical studies demonstrate clear advantages when implementing data fusion strategies:
Table 3: Performance Improvements Through Data Fusion
| Application | Single Technique Performance | Data Fusion Performance | Improvement | |
|---|---|---|---|---|
| Olive Oil Category Classification | 75-89.6% (HS-GC-IMS alone) | Up to 12% increase with mid-level fusion | +12.0% for EV class, +16.6% for V class | [75] |
| Amomi Fructus Origin Identification | 95.65% (HS-GC-IMS: PLS-DA) | 97.96% (PLS-DA with data fusion) | +2.31% accuracy | [8] |
| Olive Oil Commercial Categories | 77.8-86.7% (FGC E-nose) | Average increase of 5.3-8.7% | Enhanced classification across all categories | [75] |
Figure 2: Data Fusion Strategy Comparison and Advantages
Research Reagent Solutions and Essential Materials
Successful implementation of GC-IMS and E-Nose methodologies requires specific reagents and materials optimized for volatile compound analysis:
Table 4: Essential Research Reagents and Materials
| Item | Function | Application Examples | Technical Specifications |
|---|---|---|---|
| Headspace Vials | Containment for volatile analysis | All VOC studies | 10-40 mL, PTFE/silicone septa, clear glass [5] |
| Internal Standards | Quantification and quality control | GC-IMS calibration | Stable isotope-labeled compounds for specific matrices |
| Drift Gas | Ion mobility separation medium | GC-IMS operation | High-purity nitrogen (99.999%) or clean air [8] |
| Calibration Mixtures | Sensor calibration and response normalization | E-Nose standardization | Known VOC mixtures at precise concentrations [93] |
| Reference Materials | Method validation and quality assurance | Authenticity studies | Certified reference materials for specific commodities [8] |
| Chromatographic Columns | Compound separation | GC-IMS systems | MXT-5, MXT-1701; 15-30m length [5] [53] |
| Sensor Arrays | Odor detection | E-Nose systems | Metal oxide semiconductors (MOS), conducting polymers [19] |
The comparative analysis of GC-IMS and E-Nose technologies reveals a complementary relationship rather than a competitive one. GC-IMS excels in detailed compositional analysis, providing specific compound identification and quantification essential for understanding biochemical pathways and marker discovery. E-Nose technology offers rapid, high-throughput screening capabilities ideal for quality control applications and field-based analysis.
The documented performance improvements through data fusion strategies—ranging from 2.31% to 16.6% enhancement in classification accuracy—demonstrate the significant potential of integrated approaches [8] [75]. These methodologies enable researchers to leverage both the pattern recognition capabilities of E-Nose and the compound-specific identification power of GC-IMS, creating analytical frameworks that are more robust and informative than single-technique applications.
For researchers designing quality assessment protocols, the choice between these technologies should be guided by specific application requirements: GC-IMS for discovery-phase research requiring compound identification, E-Nose for routine quality control applications, and integrated approaches for maximum classification accuracy and robustness. Future developments in standardized data fusion protocols and integrated instrument systems will likely further enhance the accessibility and implementation of these powerful complementary techniques.
In the field of food quality assessment, the choice between targeted and non-targeted analytical approaches fundamentally shapes research design, instrumentation requirements, and data interpretation strategies. Targeted analysis focuses on the quantification of predefined compounds, while non-targeted analysis aims to comprehensively characterize a sample's chemical composition without pre-selection [95]. Within this context, Gas Chromatography-Ion Mobility Spectrometry (GC-IMS) and electronic nose (e-nose) technologies have emerged as powerful yet fundamentally different tools for volatile organic compound (VOC) analysis. The electronic nose is defined as an instrument consisting of an array of electronic chemical sensors with partial specificity and an appropriate pattern recognition system capable of recognizing simple or complex odors [18]. In contrast, GC-IMS combines the separation power of gas chromatography with the detection sensitivity of ion mobility spectrometry, enabling the separation and identification of volatile compounds based on their retention time and drift time [31] [10].
Understanding the operational principles and application boundaries of these technologies is essential for researchers designing studies in food quality, authenticity, and flavor science. This guide provides an objective comparison framework based on experimental data and technical specifications to inform appropriate technology selection for specific analytical scenarios.
Electronic Nose (E-Nose) Systems
Electronic nose technology artificially simulates the human olfactory system through an array of semi-selective chemical sensors combined with pattern recognition algorithms [12]. When VOC molecules interact with the sensor surfaces, they produce electrical signal changes that form a unique fingerprint for a given sample odor profile. Modern e-noses employ multiple sensor technologies including metal oxide semiconductors (MOS), conducting polymers (CP), quartz crystal microbalance (QCM), and surface acoustic wave (SAW) sensors, each with distinct detection mechanisms and sensitivity profiles [18]. For example, MOS sensors detect gases through changes in electrical resistance upon exposure to VOCs, while QCM sensors measure mass changes through shifts in resonant frequency [18]. The signal processing unit transforms these sensor outputs into digital signals, which are then interpreted by pattern recognition systems such as principal component analysis (PCA), linear discriminant analysis (LDA), artificial neural networks (ANNs), or support vector machines (SVMs) to identify unique odor patterns [18] [44].
Gas Chromatography-Ion Mobility Spectrometry (GC-IMS)
GC-IMS represents a hybrid analytical technique that combines two separation dimensions for enhanced VOC characterization. The technology first separates volatile compounds by their polarity and vapor pressure using gas chromatography, then further separates these compounds based on their size, shape, and charge as they drift through an electric field against a counter-current drift gas [31] [5]. The resulting data provides a two-dimensional fingerprint (retention time vs. drift time) that enables both qualitative identification and semi-quantitative analysis of volatile compounds [31] [35]. GC-IMS offers particularly high sensitivity for detecting trace-level VOCs, with detection limits often reaching parts-per-billion (ppb) or even parts-per-trillion (ppt) ranges [10]. The technique typically uses a tritium source for ionization and nitrogen as the drift gas, operating at atmospheric pressure, which simplifies operation and reduces costs compared to high-vacuum mass spectrometry systems [31].
Table 1: Core Technological Principles and Specifications
| Parameter | Electronic Nose (E-Nose) | Gas Chromatography-Ion Mobility Spectrometry (GC-IMS) |
|---|---|---|
| Analytical Principle | Sensor array with cross-selective sensitivity | Two-dimensional separation (GC + IMS) |
| Detection Mechanism | Physicochemical sensor responses | Ion separation in electric field |
| Data Output | Composite fingerprint pattern | Retention time + drift time for individual compounds |
| Typical Analysis Time | Seconds to minutes | 10-30 minutes |
| Detection Limits | Varies by sensor technology | ppb to ppt range |
| Operational Pressure | Atmospheric | Atmospheric |
Experimental Protocols and Methodologies
Standard E-Nose Analysis Protocol
Experimental protocols for e-nose analysis emphasize minimal sample preparation and rapid analysis cycles. A typical methodology follows these steps:
Sample Preparation: For solid or liquid food samples, measure 3-8 g into a 20 mL headspace vial [5]. For sesame oil adulteration detection, 5 g of oil sample is standard [44].
Headspace Generation: Incubate samples at 40°C for 300-900 seconds with constant agitation (500-960 rpm) to achieve volatile equilibrium [5] [44].
Data Acquisition: Inject headspace gas into the sensor chamber at flow rates of 300 mL/min for detection times of 200 seconds [5]. The PEN3 e-nose system uses an array of 10 metal oxide sensors with different sensitivities [5].
Sensor Recovery: Purge the system with filtered air for 300 seconds between analyses to reestablish baseline [5].
Data Processing: Apply multivariate pattern recognition algorithms (PCA, LDA, SVM, ANN) to the sensor response data for sample classification and discrimination [44] [12].
Standard GC-IMS Analysis Protocol
GC-IMS methodologies involve more detailed separation parameters and longer analysis times:
Sample Introduction: Place 1-3 mL of sample into a 20 mL headspace vial [31] [5]. For sesame oil analysis, 1 mL is typically used [31].
Headspace Incubation: Heat samples to 60-80°C for 15-30 minutes without shaking to generate volatile headspace [31] [5].
Injection Parameters: Inject 100-500 μL of headspace sample in splitless mode [31].
Chromatographic Separation: Use MXT-5 or MXT-WAX capillary columns (15-30 m length) with temperature programming from 40-60°C to 240°C over 18-30 minutes [31] [5].
IMS Detection: Operate drift tube at 45-60°C with electric field strength of 500 V/cm and nitrogen drift gas flow of 150 mL/min [31].
Data Analysis: Process 2D data points using specialized software (LAV, GC-IMS Library Search) for VOC identification and fingerprinting [5].
Comparative Performance Analysis
Analytical Capabilities for Different Application Scenarios
Table 2: Performance Comparison for Food Quality Assessment Applications
| Application Scenario | E-Nose Performance | GC-IMS Performance | Supporting Experimental Data |
|---|---|---|---|
| Adulteration Detection | LDA classification accuracy of 94.5% for sesame oil adulterated with maize oil [44] [12] | Identified 11 major VOC components explaining 82-91% of sample differences [44] | SVM sensitivity: 0.987, specificity: 0.977 [44] |
| Process Monitoring | Rapid discrimination of different Douchi fermentation stages using LDA of e-nose data [35] | Detected 17-24 differential volatile compounds in Douchi using PLS-DA [35] | Identified key markers: benzaldehyde, benzene acetaldehyde, 3-octanone [35] |
| Origin Authentication | Successfully discriminated 5 of 7 Ligusticum chuanxiong relatives using LDA [96] | Identified 118 volatile constituents with 8 differential markers including trans-Neocnidilide, β-Caryophyllene [96] | Sensor W1W showed significant positive correlation with β-Caryophyllene [96] |
| Flavor Profiling | Detected abundance of nitrogen oxides and sulfide compounds in Douchi samples [35] | Revealed 74 VOCs in sesame oil samples from different processing methods [31] | Water substitution method oil contained 42 VOCs; hot-pressing method had 29 VOCs [31] |
Technical Specifications and Operational Requirements
Table 3: Instrument Specifications and Practical Considerations
| Parameter | Electronic Nose | GC-IMS |
|---|---|---|
| Analysis Speed | Very fast (seconds to minutes) [12] | Moderate (15-50 minutes) [31] |
| Sample Throughput | High (minimal preparation) [18] | Medium (requires headspace generation) [31] |
| Operational Complexity | Low (suitable for non-experts) [12] | Medium (requires chromatographic knowledge) [10] |
| Compound Identification | Limited (pattern-based) [96] | High (with reference standards) [31] |
| Quantification Capability | Semi-quantitative [18] | Semi-quantitative to quantitative [10] |
| Method Development Time | Short (days) [12] | Medium (weeks) [10] |
| Portability | High (portable systems available) [18] | Low (primarily benchtop systems) [31] |
Decision Framework: Targeted vs. Non-Targeted Applications
The selection between e-nose and GC-IMS technologies depends primarily on the research objectives, with e-nose excelling in rapid fingerprinting for targeted applications and GC-IMS providing comprehensive compound resolution for non-targeted analysis.
When to Select Electronic Nose Technology
E-nose systems are ideally suited for applications requiring rapid, cost-effective analysis where overall odor patterns rather than specific compound identities provide sufficient information. Key application scenarios include:
Quality Control and Adulteration Screening: E-nose technology has demonstrated 94.5% classification accuracy for detecting sesame oil adulteration with maize oil using LDA, with SVM models achieving sensitivity of 0.987 and specificity of 0.977 [44] [12]. The rapid analysis (seconds to minutes) enables high-throughput screening of multiple samples.
Process Monitoring: In Douchi fermentation, e-nose successfully discriminated different fermentation stages and microbial treatments based on overall aroma profiles, with distinct response values for W5S, W1W, and W2W sensors indicating changes in nitrogen oxides and sulfide compounds [35].
Origin Authentication: For discrimination of Ligusticum chuanxiong and its medicinal relatives, e-nose with LDA successfully distinguished five of seven species based on odor differences predominantly observed in sensors W1W and W1S [96].
When to Select GC-IMS Technology
GC-IMS is the preferred choice for research applications requiring detailed compound identification and non-targeted screening. Appropriate applications include:
Marker Compound Discovery: GC-IMS identified 74 VOCs in sesame oil produced by different processing methods, specifically revealing that water substitution method oil contained 42 VOCs including Cyclopentanone and 1-Pentanol, while hot-pressed oil contained 29 VOCs including 2-methyl-1-propanol [31].
Comprehensive Flavor Profiling: In analysis of Douchi, GC-IMS detected 17 differential volatile compounds using PLS-DA, identifying specific markers including benzaldehyde, benzene acetaldehyde, 3-octanone, and ethyl 2-methylbutyrate that correlated with sensory attributes [35].
Metabolomic Studies: For Ligusticum chuanxiong species, GC-IMS identified 118 volatile constituents with 8 differential markers (trans-Neocnidilide, β-Caryophyllene, β-Selinene, etc.) that enabled hierarchical cluster analysis and relationship mapping between species [96].
Integrated Approaches and Complementary Applications
Increasingly, researchers employ e-nose and GC-IMS as complementary rather than competing technologies. The integrated workflow leverages the strengths of both systems for comprehensive aroma analysis:
This integrated approach was successfully implemented in Douchi aroma analysis, where e-nose provided rapid discrimination of samples treated with different aroma-enhancing microorganisms, while GC-IMS identified the specific volatile compounds responsible for these differences [35]. Similarly, in sesame oil adulteration detection, e-nose provided rapid classification while GC-MS (a related technique to GC-IMS) identified the precise VOCs explaining differences in e-nose signature patterns [44].
Essential Research Reagent Solutions
Table 4: Key Materials and Reagents for VOC Analysis
| Reagent/Material | Function | Application Examples |
|---|---|---|
| Standard Compounds | Retention index calibration, compound identification | 2-butanone, 2-pentanone, 2-hexanone for GC-IMS calibration [31] |
| Headspace Vials | Sample containment and volatile equilibrium | 20 mL vials for both e-nose and GC-IMS analysis [31] [5] |
| Reference Materials | Quality control, method validation | p-methoxybenzaldehyde, 3-methyl-1-butanol for Douchi analysis [35] |
| Drift Gases | Ion separation in IMS | High-purity nitrogen (≥99.999%) as drift gas for GC-IMS [31] |
| SPME Fibers | Volatile compound extraction (for GC-MS validation) | Headspace solid-phase microextraction for compound identification [96] [35] |
The selection between GC-IMS and electronic nose technologies represents a strategic decision that should align with overarching research goals, methodological requirements, and practical constraints. Electronic nose systems offer unparalleled advantages for rapid, high-throughput fingerprinting applications where overall pattern recognition suffices for sample discrimination. Conversely, GC-IMS provides superior compound resolution and identification capabilities essential for mechanistic studies and marker discovery. The most comprehensive analytical strategies increasingly leverage both technologies in complementary workflows, utilizing e-nose for initial screening and GC-IMS for detailed characterization of significant samples. This integrated approach maximizes the respective strengths of both platforms, delivering both efficiency and depth in food quality assessment research.
Conclusion
GC-IMS and Electronic Nose are not mutually exclusive but complementary technologies that offer a powerful, synergistic toolkit for modern food quality assessment. While E-Nose excels in rapid, on-line screening and pattern recognition for high-throughput industrial environments, GC-IMS provides superior compound separation and identification, crucial for detailed flavor profiling and authentication. The integration of both systems, supported by robust machine learning algorithms, represents the future of food analysis, enabling unprecedented accuracy and depth in VOC characterization. Future directions should focus on miniaturizing hardware, developing more adaptive AI models to combat sensor drift, and establishing standardized protocols to facilitate widespread adoption. For researchers, this technological evolution paves the way for more resilient, transparent, and data-driven food safety systems across the global supply chain, with significant implications for quality control and consumer trust.
References
- 1. Gas Chromatography–Ion Mobility Spectrometry for Food Flavor Analysis [https://www.news-medical.net/life-sciences/Gas-chromatographye28093ion-mobility-spectrometry-for-Food-Flavor-Analysis-A-New-Frontier.aspx]
- 2. A Systematic Review of the Use of Electronic Nose and ... [https://www.mdpi.com/2227-9040/13/7/262]
- 3. Gas Chromatography and Ion Mobility Spectrometry: A Perfect Match? [https://www.chromatographyonline.com/view/gas-chromatography-and-ion-mobility-spectrometry-a-perfect-match-]
- 4. - GC | Encyclopedia MDPI IMS [https://encyclopedia.pub/entry/15702]
- 5. E-nose, E-tongue Combined with GC-IMS to Analyze the ... [https://pmc.ncbi.nlm.nih.gov/articles/PMC9689958/]
- 6. The Aroma, Taste Contributions, and Flavor Evaluation Based on... [https://pubmed.ncbi.nlm.nih.gov/40238339/]
- 7. HS-GC-IMS and HS-SPME/GC-MS coupled with E-nose ... [https://www.sciencedirect.com/science/article/pii/S2665927123002411]
- 8. Frontiers | Quality identification of Amomi fructus using E- nose ... [https://www.frontiersin.org/journals/chemistry/articles/10.3389/fchem.2025.1544743/full]
- 9. Gas-phase volatilomic approaches for quality control of brewing hops... [https://pmc.ncbi.nlm.nih.gov/articles/PMC7497504/]
- 10. Recent advances in chromatography-mass spectrometry ... [https://www.sciencedirect.com/science/article/abs/pii/S0308814622027765]
- 11. Electronic nose - Wikipedia [https://en.wikipedia.org/wiki/Electronic_nose]
- 12. Electronic nose for detection of food adulteration: a review [https://pmc.ncbi.nlm.nih.gov/articles/PMC8814237/]
- 13. Biologically Inspired for Pattern - Recognition E nose Sensors [https://link.springer.com/chapter/10.1007/978-3-319-49586-6_10]
- 14. Comparative Study of E-Nose, GC-MS, and GC-IMS to ... [https://www.mdpi.com/2297-8739/10/4/256]
- 15. (PDF) Classifying continuous, real-time e - nose data using... sensor [https://www.academia.edu/85344723/Classifying_continuous_real_time_e_nose_sensor_data_using_a_bio_inspired_spiking_network_modelled_on_the_insect_olfactory_system]
- 16. Gas chromatography-ion mobility spectrometry (GC-IMS) ... [https://pubmed.ncbi.nlm.nih.gov/38817147/]
- 17. Applications of electronic nose (e-nose) and ... [https://www.sciencedirect.com/science/article/pii/S2589721720300180]
- 18. A Comprehensive Review on Sensor-Based Electronic Nose ... [https://pmc.ncbi.nlm.nih.gov/articles/PMC12301011/]
- 19. A Systematic Review of the Applications of Electronic Nose ... [https://www.mdpi.com/2227-9040/13/5/161]
- 20. Inductively Coupled Plasma-Mass Spectrometry (ICP-MS), a ... [https://pmc.ncbi.nlm.nih.gov/articles/PMC9689705/]
- 21. nose, HS-SPME-GC–MS/MS, and HS-GC-IMS technologies [https://pmc.ncbi.nlm.nih.gov/articles/PMC12269471/]
- 22. A Comprehensive Review on Sensor-Based Electronic ... [https://www.mdpi.com/1424-8220/25/14/4437]
- 23. Review on food quality assessment using machine ... [https://www.sciencedirect.com/science/article/pii/S2590137023000626]
- 24. EAS Award Winner Nicholas Snow Highlights Key Trends ... [https://www.chromatographyonline.com/view/gas-chromatography-trends-2025-nicholas-snow]
- 25. Electronic nose for the detection and discrimination of ... [https://www.sciencedirect.com/science/article/abs/pii/S0165993624004412]
- 26. Microbial volatile organic compounds for food quality and ... [https://www.sciencedirect.com/science/article/abs/pii/S0924224425005503]
- 27. Recent progress in food flavor analysis using gas chromatography-ion... [https://pubmed.ncbi.nlm.nih.gov/32014672/]
- 28. GC-MS, GC-IMS, and E-Nose Analysis of Volatile Aroma ... [https://pmc.ncbi.nlm.nih.gov/articles/PMC10855196/]
- 29. A comprehensive review of electronic nose systems [https://www.sciencedirect.com/science/article/abs/pii/S1385894725103252]
- 30. Performance of a Novel Electronic Nose for the Detection ... [https://www.mdpi.com/1424-8220/24/18/5918]
- 31. Investigation of the differences in volatile organic ... [https://www.frontiersin.org/journals/nutrition/articles/10.3389/fnut.2025.1611006/full]
- 32. Electronic nose analysis and statistical methods for ... [https://research.fs.usda.gov/treesearch/66677]
- 33. Overview of Liquid Sample Preparation Techniques for ... [https://pmc.ncbi.nlm.nih.gov/articles/PMC11477957/]
- 34. HS-GC-IMS and HS-SPME/GC-MS coupled with E-nose and E ... [https://pmc.ncbi.nlm.nih.gov/articles/PMC10805766/]
- 35. An integrated analysis using E-nose, GC-IMS, GC–MS, and ... [https://www.sciencedirect.com/science/article/abs/pii/S0963996924002515]
- 36. Comparison of Sample Preparation Methods for ... [https://www.mdpi.com/2409-9279/2/3/72]
- 37. New Sample Preparation Products and Accessories for ... [https://www.chromatographyonline.com/view/new-sample-preparation-products-and-accessories-for-2024-2025]
- 38. Innovative sample preparation techniques in food analysis [https://www.sciencedirect.com/science/article/pii/S2772582025000440]
- 39. Green chemistry methods for food analysis: Overview of ... [https://www.sciencedirect.com/science/article/pii/S2772582023000037]
- 40. Investigation of the differences in volatile organic ... [https://pubmed.ncbi.nlm.nih.gov/40823037/]
- 41. How is sesame oil obtained? [https://us.typology.com/library/how-is-sesame-oil-made]
- 42. Adulteration detection of essence in sesame oil based on ... [https://www.sciencedirect.com/science/article/abs/pii/S0308814621023797]
- 43. Exploration of simulated human olfactory system and its ... [https://www.sciencedirect.com/science/article/abs/pii/S092422442500113X]
- 44. VOC analysis with e-nose and GC-MS for rapid detection of ... [https://research.fs.usda.gov/treesearch/66678]
- 45. Flavor optimization in dairy fermentation: From strain ... [https://www.sciencedirect.com/science/article/abs/pii/S0924224423003096]
- 46. Odor-active aroma compounds in traditional fermented ... [https://pmc.ncbi.nlm.nih.gov/articles/PMC11795106/]
- 47. Technological tools for the measurement of sensory ... [https://pmc.ncbi.nlm.nih.gov/articles/PMC10844804/]
- 48. Comparison of Aroma and Taste Profiles Between Two ... [https://www.mdpi.com/2311-5637/10/11/543]
- 49. Characterization of key aroma-active compounds in ... [https://pmc.ncbi.nlm.nih.gov/articles/PMC10865218/]
- 50. Innovative Approaches in Sensory Food Science [https://www.mdpi.com/2076-3417/15/8/4538]
- 51. Meat Quality Assessment by Electronic Nose (Machine ... [https://pmc.ncbi.nlm.nih.gov/articles/PMC3312430/]
- 52. E-nose based control charts for fish freshness evaluation [https://www.sciencedirect.com/science/article/pii/S0963996925006507]
- 53. of gas chromatography-ion mobility spectrometry... Application [https://pubmed.ncbi.nlm.nih.gov/34189733/]
- 54. as a Tool for Monitoring the Electronic of Nose . Authenticity Food [https://link.springer.com/article/10.1007/s12161-016-0739-4]
- 55. Techniques for Food Authentication: Trends and Emerging ... [https://pmc.ncbi.nlm.nih.gov/articles/PMC10048066/]
- 56. HS-GC-IMS and chemometric data treatment for food ... [https://www.sciencedirect.com/science/article/abs/pii/S0956713518305371]
- 57. GC-IMS and FGC-Enose fingerprint as screening tools for ... [https://www.sciencedirect.com/science/article/abs/pii/S0026265X2031540X]
- 58. Novel analytical method for detection of orange juice adulteration... [https://pmc.ncbi.nlm.nih.gov/articles/PMC6105224/]
- 59. Investigation of the differences in volatile organic ... [https://pmc.ncbi.nlm.nih.gov/articles/PMC12354378/]
- 60. Study on Interference Suppression Algorithms for ... [https://pmc.ncbi.nlm.nih.gov/articles/PMC5948617/]
- 61. Rapid assessment of the authenticity of limequat fruit using the... [https://pmc.ncbi.nlm.nih.gov/articles/PMC6105222/]
- 62. Rapid distance estimation of odor sources by electronic ... [https://www.sciencedirect.com/science/article/abs/pii/S0925400524013959]
- 63. A Comparison of Various Algorithms for Classification ... [https://pmc.ncbi.nlm.nih.gov/articles/PMC7825773/]
- 64. Insights from GC × GC-O-TOF-MS, E-nose, and sensory ... [https://pmc.ncbi.nlm.nih.gov/articles/PMC10831152/]
- 65. identification of Amomi fructus using E- Quality , HS- nose - GC , and... IMS [https://pmc.ncbi.nlm.nih.gov/articles/PMC11840568/]
- 66. Flavor Quality of Irradiated Deastringent... :: SSRN Assessment [https://papers.ssrn.com/sol3/papers.cfm?abstract_id=4836238]
- 67. Intelligent Gas Sensors for Food Safety and Quality Monitoring [https://pmc.ncbi.nlm.nih.gov/articles/PMC12346065/]
- 68. Review Article Application and development trends of gas ... [https://www.sciencedirect.com/science/article/pii/S0026265X21006135]
- 69. Full Workflows for the Analysis of Gas Chromatography-Ion ... [https://pubmed.ncbi.nlm.nih.gov/34577363/]
- 70. Pushing Peak Shapes to Perfection by High-Temperature ... [https://www.mdpi.com/2227-9040/13/4/131]
- 71. Dynamic changes of volatile compounds during the ... [https://www.sciencedirect.com/science/article/abs/pii/S0308814625012592]
- 72. Electronic Sensing Technologies in Food Quality Assessment [https://www.mdpi.com/2076-3417/15/3/1530]
- 73. HS-GC-IMS Analysis of Volatile Organic Compounds in ... [https://pmc.ncbi.nlm.nih.gov/articles/PMC10536806/]
- 74. Tutorial The impact of signal pre-processing on the final ... [https://www.sciencedirect.com/science/article/abs/pii/S0003267018312972]
- 75. Data fusion of headspace gas-chromatography ion mobility ... [https://www.sciencedirect.com/science/article/pii/S0260877424005156]
- 76. Production Systems and Feeding Strategies in the Aromatic ... [https://pmc.ncbi.nlm.nih.gov/articles/PMC12524156/]
- 77. Recent advances in signal processing algorithms for ... [https://www.sciencedirect.com/science/article/abs/pii/S0039914024015194]
- 78. Non-Targeted Screening Approaches for Profiling of ... [https://pmc.ncbi.nlm.nih.gov/articles/PMC8468721/]
- 79. Electronic nose, HS-GC-IMS, HS-SPME-GC-MS, and deep ... [https://www.sciencedirect.com/science/article/abs/pii/S0308814625025932]
- 80. of Comparison -based mass and solid... spectrometry electronic nose [https://pubmed.ncbi.nlm.nih.gov/12696974/]
- 81. Sweat-based stress screening with gas chromatography– ... [https://www.sciencedirect.com/science/article/abs/pii/S0003267024008304]
- 82. Application and development trends of gas ... [https://www.sciencedirect.com/science/article/abs/pii/S0026265X21006135]
- 83. Evaluation of flavor profile in blown pack spoilage meatballs via... [https://link.springer.com/article/10.1007/s11694-022-01631-8]
- 84. Evaluating LDA and PLS-DA Algorithms for Food ... [https://www.mdpi.com/1999-4893/18/12/733]
- 85. Mastering PCA for Nutritional Insights [https://www.numberanalytics.com/blog/mastering-pca-nutritional-epidemiology-research]
- 86. Interpreting and Reporting Principal in Component ... Analysis Food [https://link.springer.com/article/10.1007/s12161-019-01605-5]
- 87. A new sub-class linear discriminant for miniature ... [https://www.sciencedirect.com/science/article/pii/S0169743924000765]
- 88. Machine Learning for Quality Control in the Food Industry [https://pmc.ncbi.nlm.nih.gov/articles/PMC12523314/]
- 89. A Review of the Discriminant Analysis Methods for Food ... [https://pmc.ncbi.nlm.nih.gov/articles/PMC7867108/]
- 90. Application of principal ( component ) as a sensory... analysis PCA [https://pmc.ncbi.nlm.nih.gov/articles/PMC3614048/]
- 91. Ion Mobility Spectrometry in Food Analysis [https://pmc.ncbi.nlm.nih.gov/articles/PMC6696101/]
- 92. GC-IMS and Bioelectronic Sensors Reveal Distinctive ... [https://pmc.ncbi.nlm.nih.gov/articles/PMC12385396/]
- 93. Applications of Electronic Nose, Electronic Eye and Electronic ... [https://pmc.ncbi.nlm.nih.gov/articles/PMC9860605/]
- 94. of flavor components between normal and gas-producing... Comparison [https://pubs.rsc.org/en/content/articlelanding/2025/ay/d4ay01993h]
- 95. Nontargeted Analysis Study Reporting Tool: A Framework ... [https://pmc.ncbi.nlm.nih.gov/articles/PMC9408805/]
- 96. E-Nose and HS-SPME-GC-MS unveiling the scent ... [https://www.frontiersin.org/journals/plant-science/articles/10.3389/fpls.2025.1476810/full]