Inflammation at the Crossroads: A Scientific Analysis of Mediterranean vs. Western Diet Impacts on Inflammatory Biomarkers
This review synthesizes contemporary scientific evidence on the distinct effects of the Mediterranean Diet (MedDiet) and the Western Diet (WD) on systemic inflammatory markers, crucial for chronic disease pathogenesis.
Inflammation at the Crossroads: A Scientific Analysis of Mediterranean vs. Western Diet Impacts on Inflammatory Biomarkers
Abstract
This review synthesizes contemporary scientific evidence on the distinct effects of the Mediterranean Diet (MedDiet) and the Western Diet (WD) on systemic inflammatory markers, crucial for chronic disease pathogenesis. We explore the foundational mechanisms linking dietary patterns to inflammation, detail methodological approaches for biomarker assessment in research and clinical trials, address key challenges in diet adherence and study design, and provide a comparative validation of the anti-inflammatory efficacy of the MedDiet against the pro-inflammatory nature of the WD. Targeted at researchers and drug development professionals, this analysis highlights dietary modulation of inflammation as a strategic avenue for preventive health and adjuvant therapeutic development.
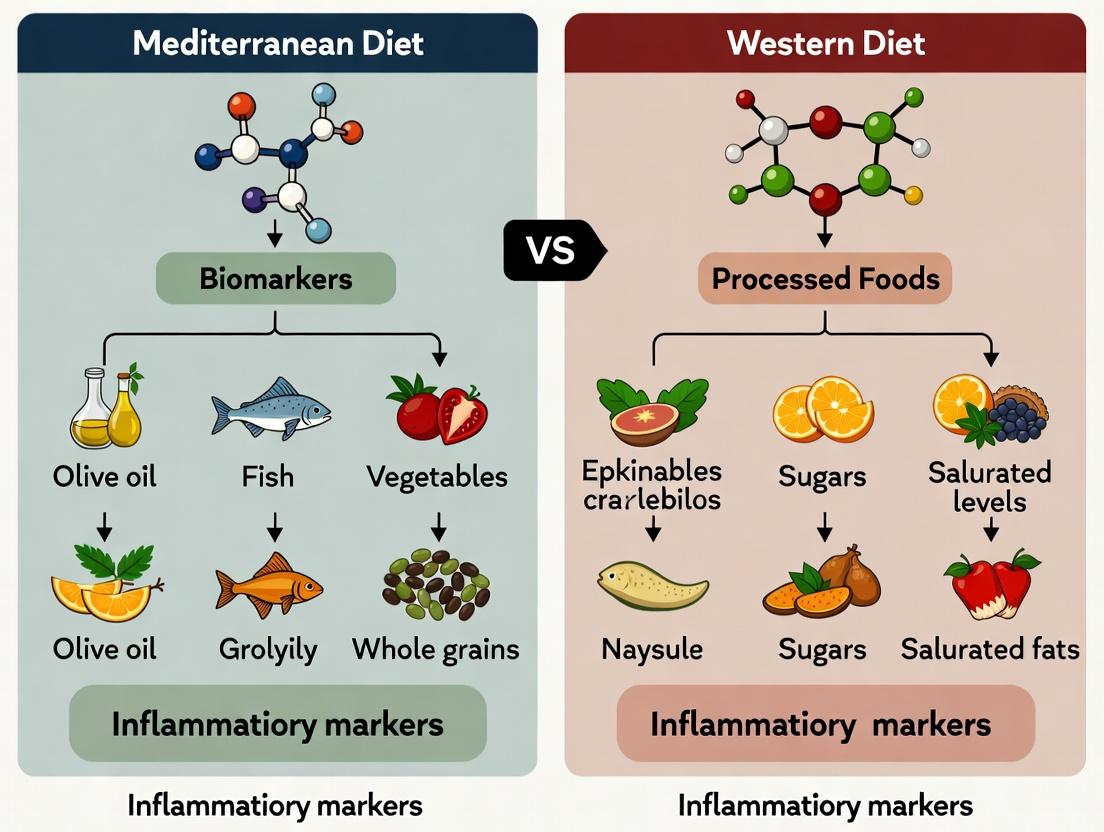
Decoding the Inflammation-Diet Nexus: Core Mechanisms of Mediterranean and Western Dietary Patterns
Quantitative Nutritional Composition Comparison
The foundational difference between the Mediterranean Diet (MedDiet) and the Western Diet (WD) lies in their macronutrient and micronutrient profiles, which directly influence inflammatory pathways. The following table synthesizes data from nutritional epidemiology studies and controlled feeding trials.
Table 1: Core Nutritional Composition Paradigms (Per 2000 kcal)
| Dietary Component | Mediterranean Diet | Western Diet | Key Implications for Inflammation |
|---|---|---|---|
| Total Fat (%E) | 35-40% | 35-40% | Source is critical, not total amount. |
| - SFA (%E) | <8% | 12-15% | SFA promotes TLR4/NF-κB signaling. |
| - MUFA (%E) | 20-25% (primarily olive oil) | 12-15% | Oleic acid (MUFA) is anti-inflammatory. |
| - PUFA (%E) | ~6% | ~8% | Ratio is decisive. |
| - n-6:n-3 PUFA Ratio | 2:1 to 4:1 | 15:1 to 20:1 | High n-6 promotes pro-inflammatory eicosanoids. |
| Carbohydrates (%E) | 40-45% | 45-50% | Quality is the primary differentiator. |
| - Fiber (g/day) | 30-40g | 15-20g | Fiber fermented to SCFAs (e.g., butyrate) inhibits HDAC/NF-κB. |
| - Free Sugars (%E) | <10% | 15-20% | Fructose promotes de novo lipogenesis & ROS. |
| Protein (%E) | 15-20% | 15-20% | Plant vs. Animal source alters gut microbiota. |
| - Plant Protein (% total) | ~65% | ~35% | Associated with beneficial microbial taxa. |
| - Red/Processed Meat (g/day) | <50g | 100-150g | Heme iron & AGEs promote oxidative stress. |
| Phytochemicals & Micronutrients | High | Low | Modulate Nrf2 & NF-κB pathways. |
| - Polyphenols (mg/day) | 800-1200 | <400 | Direct antioxidant & signaling effects. |
| - Vitamin E (mg/day) | 15-20 | 8-10 | Membrane antioxidant. |
| - Magnesium (mg/day) | 400-500 | 250-300 | Cofactor for anti-oxidative enzymes. |
Experimental Protocols for Inflammatory Marker Analysis
Key methodologies for investigating the impact of these dietary patterns on inflammatory markers in clinical research.
Protocol 1: Randomized Controlled Feeding Trial (Crossover Design)
- Objective: To compare the acute (4-week) effects of an isocaloric MedDiet vs. WD on plasma inflammatory cytokines.
- Participants: n=40 healthy adults, BMI 25-30, aged 30-65.
- Dietary Intervention: Meals prepared in a metabolic kitchen. MedDiet: Rich in EVOO, nuts, whole grains, fatty fish (2x/week), fruits/vegetables (≥5 servings/day). WD: Rich in refined grains, butter, red/processed meat, sugar-sweetened beverages, low fruit/vegetable variety.
- Washout Period: 4-week habitual diet between arms.
- Primary Outcomes: Fasting plasma IL-6, TNF-α, CRP, and adiponectin.
- Sample Collection & Analysis: Fasting blood draws at baseline and post-intervention. Cytokines quantified using multiplex Luminex xMAP technology. High-sensitivity CRP via immunoturbidimetric assay.
Protocol 2: Ex Vivo Immune Cell Challenge Assay
- Objective: To assess the functional immunomodulatory capacity of diet.
- Method: Isolate peripheral blood mononuclear cells (PBMCs) from participants post-dietary intervention.
- Culture & Stimulation: Seed PBMCs in 96-well plates. Stimulate with 100 ng/mL LPS for 24 hours.
- Readout: Measure supernatant levels of IL-1β and IL-10 via ELISA. Calculate IL-1β/IL-10 ratio as an index of inflammatory bias.
Protocol 3: Targeted Oxylipin Profiling (LC-MS/MS)
- Objective: To characterize the downstream lipid mediator landscape influenced by dietary PUFA.
- Sample Preparation: Solid-phase extraction of lipids from 500 µL of participant plasma.
- Analysis: Liquid chromatography tandem mass spectrometry (LC-MS/MS) with multiple reaction monitoring (MRM).
- Targets: Quantify pro-inflammatory (e.g., PGE2, LTB4 from AA) and pro-resolving (e.g., RvD1 from DHA, LXA4) mediators.
Visualization of Key Signaling Pathways
Title: Dietary Modulation of NF-κB and Pro-Resolving Pathways
Title: Crossover Trial & Omics Analysis Workflow
The Scientist's Toolkit: Key Research Reagent Solutions
Table 2: Essential Reagents for Dietary Inflammation Research
| Reagent / Material | Supplier Examples | Primary Function in Research |
|---|---|---|
| High-Sensitivity CRP (hsCRP) ELISA Kit | R&D Systems, Abcam, Sigma-Aldrich | Quantifies low-grade systemic inflammation; key cardiovascular risk predictor. |
| Multiplex Cytokine Panels (Human) | Bio-Rad (Bio-Plex), Thermo Fisher (Luminex), MSD | Measures multiple cytokines (IL-6, TNF-α, IL-1β, IL-10) simultaneously from small sample volumes. |
| Recombinant Human LPS (E. coli O111:B4) | InvivoGen, Sigma-Aldrich | Standardized ligand for TLR4 activation in ex vivo PBMC challenge assays. |
| PBMC Isolation Tubes (e.g., CPT) | BD Biosciences, Sigma-Aldrich | Enables rapid separation of mononuclear cells from whole blood for functional immune assays. |
| Targeted Oxylipin & SPM LC-MS/MS Kits | Cayman Chemical, Cell Sciences | Provides standardized columns, internal standards, and protocols for lipid mediator profiling. |
| Nuclear Extraction Kit | Active Motif, Thermo Fisher | Isolates nuclear protein fractions for assessing NF-κB p65 translocation via Western blot or ELISA. |
| Nrf2 Transcription Factor Assay Kit | Abcam, Cayman Chemical | Measures Nrf2 DNA-binding activity in nuclear extracts, quantifying antioxidant pathway activation. |
| Stable Isotope-Labeled Fatty Acids (13C-ALA, 13C-EPA) | Cambridge Isotope Labs, Sigma-Aldrich | Tracer compounds for metabolic flux studies to track dietary PUFA incorporation and metabolism. |
This comparison guide, framed within the ongoing research thesis comparing the Mediterranean diet (MD) and Western diet (WD) on inflammatory markers, objectively analyzes the mechanistic role of key Western diet components—saturated fatty acids (SFA), ultra-processed foods (UPFs), and dietary additives—in driving cytokine production. The data synthesizes current experimental findings to compare the inflammatory potency and pathways of these dietary factors.
Experimental Protocols Cited
1. Protocol for Assessing SFA-Induced Inflammation in Macrophages
- Cell Culture: Differentiate human monocyte THP-1 cells into macrophages using 100 nM PMA for 48 hours.
- Treatment: Stimulate macrophages with physiologically relevant concentrations of SFAs (e.g., palmitic acid, 200-500 µM) complexed with bovine serum albumin (BSA). Control groups receive BSA alone or unsaturated fatty acids (e.g., oleic acid).
- Incubation: Treat cells for 6-24 hours.
- Analysis: Collect supernatant for cytokine measurement (IL-1β, IL-6, TNF-α) via ELISA. Harvest cells for RNA extraction and qPCR analysis of cytokine gene expression, or for protein extraction to assess NF-κB and NLRP3 inflammasome activation via western blot.
2. Protocol for UPF/Additive Impact on Gut Epithelial Barrier and Inflammation
- Model System: Use human intestinal epithelial cell lines (e.g., Caco-2) cultured on transwell inserts to establish polarized monolayers with tight junctions.
- Treatment: Apically expose monolayers to common food emulsifiers (e.g., 0.1-1.0% polysorbate-80, carboxymethylcellulose) or artificial sweeteners (e.g., sucralose, 1-5 mM) for up to 72 hours.
- Barrier Integrity Measurement: Assess transepithelial electrical resistance (TEER) daily. Post-treatment, perform immunofluorescence for tight junction proteins (occludin, ZO-1).
- Co-culture Inflammation Assay: Place activated immune cells (e.g., peripheral blood mononuclear cells) in the basolateral compartment. Measure cytokine release in the basolateral medium post-exposure.
Comparative Data on Inflammatory Drivers
Table 1: Comparison of Pro-Inflammatory Effects from Dietary Components
| Component | Example | Primary Model System | Key Cytokines Upregulated | Proposed Signaling Pathway | Magnitude of Effect (vs. Control) |
|---|---|---|---|---|---|
| Saturated Fatty Acid (SFA) | Palmitic Acid (500 µM) | Human Macrophages | TNF-α, IL-1β, IL-6 | TLR4/MyD88 → NF-κB; NLRP3 Inflammasome | 8-12 fold increase (TNF-α) |
| Ultra-Processed Food Emulsifier | Polysorbate-80 (1.0%) | Intestinal Epithelial Monolayer + Immune Cells | IL-6, IL-1β, MCP-1 | TLR4/LPS signaling → NF-κB; Microbiota Dysbiosis | 4-6 fold increase (IL-6) |
| Artificial Sweetener | Sucralose (5 mM) | Intestinal Epithelial Monolayer | IL-8, IL-1β | Altered Bile Acid Signaling → Caspase-1 activation | 3-4 fold increase (IL-8) |
| Advanced Glycation End Product (AGE) | MG-H1 (from UPFs) | Endothelial Cells | IL-6, TNF-α | RAGE → NF-κB & MAPK pathways | 5-7 fold increase (IL-6) |
Table 2: Contrast with Mediterranean Diet Components
| Component | Example | Effect on Cytokine Production | Proposed Mechanism |
|---|---|---|---|
| Monounsaturated Fatty Acid | Oleic Acid (500 µM) | Suppresses SFA-induced TNF-α | Inhibits TLR4 dimerization and downstream signaling. |
| Polyphenol | Resveratrol (from grapes) | Reduces IL-1β, IL-6 | Activates SIRT1, inhibits NF-κB and NLRP3 inflammasome. |
| Fiber | Inulin (soluble) | Increases anti-inflammatory IL-10 | Fermented to SCFAs (e.g., butyrate), which inhibit HDAC and promote Treg cells. |
Visualizations
Title: SFA-Induced Cytokine Production via TLR4 and NLRP3 Pathways
Title: Western vs. Mediterranean Diet: Contrasting Inflammatory Pathways
The Scientist's Toolkit: Key Research Reagent Solutions
Table 3: Essential Reagents for Studying Diet-Induced Inflammation
| Reagent/Material | Supplier Examples | Function in Research |
|---|---|---|
| Fatty Acid-BSA Complexes | Sigma-Aldrich, Cayman Chemical | Deliver physiologically relevant, soluble fatty acids (SFA, MUFA) to cell cultures. |
| Recombinant Human M-CSF | PeproTech, R&D Systems | Differentiate primary human monocytes into macrophages for more physiologically relevant models. |
| Human TLR4 Reporter Cell Line | InvivoGen | Specifically screen compounds for TLR4 pathway activation. |
| NLRP3 Inhibitor (MCC950) | Tocris Bioscience, MedChemExpress | Pharmacologically confirm the role of the NLRP3 inflammasome in cytokine production. |
| Transwell Permeable Supports | Corning, Falcon | Culture intestinal epithelial cell monolayers for barrier integrity and co-culture studies. |
| TEER Measurement System | World Precision Instruments (EVOM2) | Quantitatively assess the integrity of epithelial tight junctions in real-time. |
| Multiplex Cytokine ELISA Panels | Bio-Rad, Meso Scale Discovery, R&D Systems | Simultaneously quantify a broad panel of pro- and anti-inflammatory cytokines from limited sample volumes. |
| 16S rRNA Sequencing Kits | Illumina (MiSeq), Qiagen | Analyze changes in gut microbiota composition induced by dietary additives in vivo. |
This comparison guide is framed within a broader thesis investigating the differential impacts of the Mediterranean Diet (MedDiet) versus the Western Diet (WD) on systemic inflammatory markers. Chronic, low-grade inflammation is a hallmark of many non-communicable diseases. This guide objectively compares the anti-inflammatory "arsenal" of the MedDiet—specifically its bioactive compounds, polyphenols, and fiber—against components representative of a WD, based on experimental data from cellular, animal, and human intervention studies.
Comparative Analysis of Dietary Components on Inflammatory Markers
Table 1: Comparison of Key Anti-Inflammatory Dietary Components
| Component (Source) | Representative MedDiet Source | Representative WD Source/Deficiency | Primary Experimental Model | Key Inflammatory Marker Outcome (vs. Control) | Proposed Mechanism |
|---|---|---|---|---|---|
| Polyphenols (e.g., Oleuropein) | Extra Virgin Olive Oil | Refined Olive Oil / Low Polyphenol Oil | Human RCT (PREDIMED) | ↓ CRP (~0.5 mg/L), ↓ IL-6 | Inhibition of NF-κB and MAPK pathways; Nrf2 activation |
| Omega-3 PUFA | Fatty Fish (EPA/DHA) | High Omega-6 PUFA (Corn Oil) | Mouse Model of Colitis | ↓ TNF-α (~40%), ↓ COX-2 expression | Precursor to SPMs (Resolvins, Protectins) |
| Fiber (Soluble) | Legumes, Fruits, Vegetables | Low-Fiber Processed Foods | In vitro Fermentation + Cell Assay | ↑ SCFA (Butyrate) Production; ↓ LPS-induced IL-8 (~60%) | GPR41/43 activation; HDAC inhibition; Gut barrier enhancement |
| Carotenoids (e.g., Lycopene) | Tomatoes, Cooked | Low Vegetable Intake | Human Supplementation Trial | ↓ sICAM-1 (~15%) | Scavenging of ROS; Inhibition of NF-κB |
| Flavonoids (e.g., Quercetin) | Capers, Onions, Red Wine | Absent in Typical WD | LPS-stimulated Macrophage Cell Line | ↓ iNOS & NO production (~70%) | Modulation of TLR4/MyD88 signaling |
| Study (Year) | Duration | MedDiet Group (n) | Western Diet Group (n) | Change in CRP (mg/L) | Change in IL-6 (pg/mL) | Change in TNF-α (pg/mL) | Notes |
|---|---|---|---|---|---|---|---|
| PREDIMED (2018) Sub-analysis | 5 Years | ~2,900 | ~2,900 | -0.5* | -0.3* | -0.4 | *MedDiet + EVOO showed greatest effect |
| Lopez-Garcia et al. (2014) | 12 Weeks | 25 | 25 | -1.2* | -1.1* | -0.8* | Controlled feeding study |
| "MEDINA" RCT (2022) | 6 Months | 82 | 79 | -0.7* | -0.9* | NS | Focused on obese subjects |
*Statistically significant (p < 0.05). NS: Not Significant.
Experimental Protocols for Key Cited Studies
Protocol 1: In Vitro Macrophage Anti-Inflammatory Assay (Quercetin)
- Cell Line: RAW 264.7 murine macrophages.
- Treatment: Pre-treatment with quercetin (10-100 µM) or vehicle control for 2h.
- Stimulation: Addition of LPS (100 ng/mL) for 18-24h to induce inflammation.
- Readouts:
- NO Production: Griess reagent assay on culture supernatant.
- Cytokines: TNF-α, IL-6 via ELISA.
- Protein Expression: iNOS, COX-2 via western blot.
- Pathway Analysis: NF-κB nuclear translocation via immunofluorescence or electrophoretic mobility shift assay (EMSA).
Protocol 2: Short-Chain Fatty Acid (SCFA) Production & Barrier Function
- Fecal Fermentation Model: Batch culture systems inoculated with human fecal microbiota.
- Substrate: MedDiet-like fiber mix (inulin, resistant starch, pectin) vs. WD-like low-fiber control.
- Fermentation: Anaerobic conditions, 37°C, 24-48h.
- SCFA Analysis: GC-FID or LC-MS/MS quantification of acetate, propionate, butyrate.
- Functional Cell Assay: Apply fermented supernatants to Caco-2 intestinal epithelial monolayers. Induce inflammation with TNF-α or LPS. Measure trans-epithelial electrical resistance (TEER) and IL-8 secretion.
Protocol 3: Human RCT Protocol (Standardized)
- Design: Parallel-group, randomized controlled trial.
- Participants: Adults with elevated cardiovascular risk or metabolic syndrome.
- Intervention (MedDiet): Personalized dietary advice + provision of key foods (EVOO, nuts). High compliance verification via urinary polyphenol metabolites (e.g., hydroxytyrosol) or plasma α-linolenic acid.
- Control (WD): Advice to follow a low-fat diet or continue habitual diet.
- Blood Sampling & Analysis: Fasting blood draws at 0, 6, 12 months.
- High-Sensitivity CRP: Immunoturbidimetric assay.
- Cytokines (IL-6, TNF-α, IL-1β): Multiplex electrochemiluminescence.
- Oxidative Stress: Plasma F2-isoprostanes via GC-MS.
Visualizations of Signaling Pathways and Workflows
Title: MedDiet Polyphenols Inhibit NF-κB and Activate Nrf2 Pathways
Title: Fiber to SCFA: Anti-Inflammatory Gut-Brain Axis Pathway
The Scientist's Toolkit: Research Reagent Solutions
Table 3: Essential Research Reagents for MedDiet Anti-Inflammatory Research
| Item | Function / Application | Example Vendor / Cat. No. (Illustrative) |
|---|---|---|
| High-Sensitivity CRP (hsCRP) ELISA Kit | Quantification of low-grade inflammation in human serum/plasma. | R&D Systems (DCRP00) |
| Multiplex Cytokine Panels (Human/Mouse) | Simultaneous measurement of IL-6, TNF-α, IL-1β, IL-10, etc., from limited sample volumes. | Meso Scale Discovery (V-PLEX) |
| Lipopolysaccharide (LPS) from E. coli O111:B4 | Standard inflammogen for stimulating TLR4 pathway in vitro (macrophages) and in vivo. | Sigma-Aldrich (L2630) |
| NF-κB (p65) Transcription Factor Assay Kit | Measures NF-κB binding activity in nuclear extracts (ELISA-based). | Cayman Chemical (10007889) |
| Short-Chain Fatty Acid (SCFA) Standard Mix | Calibration standards for quantifying acetate, propionate, butyrate via GC-MS/LC-MS. | MilliporeSigma (CRM46975) |
| Polyphenol Reference Standards (e.g., Hydroxytyrosol, Quercetin, Oleuropein) | Quantifying dietary biomarkers in biospecimens or for treatment in vitro. | ChromaDex, Phytolab |
| GPR41/43 (FFAR2/3) Antibodies | Detecting expression of SCFA receptor proteins in tissues/cells via western blot or IHC. | Abcam (ab203082, ab229487) |
| Transwell Permeable Supports (Caco-2) | Culturing intestinal epithelial monolayers for gut barrier function assays (TEER). | Corning (3460) |
| Fecal Microbiota Transplantation (FMT) Kit (Mouse) | Standardizing gut microbiota studies in gnotobiotic or antibiotic-treated mice. | OpenBiome, in-house preparation |
| Recombinant Human/Mouse TNF-α | Pro-inflammatory cytokine used to induce inflammatory responses in cell models. | PeproTech (300-01A, 315-01A) |
This comparison guide is framed within the thesis research investigating the differential impacts of the Mediterranean Diet (MedDiet) versus the Western Diet (WD) on systemic inflammatory markers, with a specific focus on the mediating role of gut microbiota. Dysbiosis induced by dietary patterns is a critical factor modulating host immune responses and low-grade chronic inflammation.
Comparison Guide: Diet-Induced Microbial Shifts and Inflammatory Outcomes
Table 1: Comparison of Dietary Impact on Key Microbial Taxa and Associated Metabolites
| Metric | Mediterranean Diet (MedDiet) | Western Diet (WD) | Key Experimental Support |
|---|---|---|---|
| Firmicutes/Bacteroidetes Ratio | Decreased or lower ratio | Significantly increased | 16S rRNA sequencing in human RCTs (De Filippis et al., 2016) |
| Prevotella Abundance | Higher (Prevotella copri) | Lower | Meta-analysis of gut metagenomes (Wu et al., 2021) |
| Faecalibacterium prausnitzii | Enriched (Anti-inflammatory) | Depleted | qPCR and fluorescence in situ hybridization (FISH) |
| Short-Chain Fatty Acid (SCFA) Production | High (esp. Butyrate, Propionate) | Low | GC-MS quantification of fecal/plasma SCFAs |
| Endotoxin (LPS) Burden | Lower plasma LPS | Elevated plasma LPS | LAL assay for LPS activity; EndoCAb IgM titers |
| Primary Bile Acids | Lower conversion to secondary | Higher systemic levels | LC-MS metabolomic profiling |
Table 2: Downstream Impact on Systemic Inflammatory Markers
| Inflammatory Marker | Response to MedDiet | Response to WD | Assay Method & Key Study |
|---|---|---|---|
| High-sensitivity CRP (hs-CRP) | Significant decrease | Significant increase | Immunoturbidimetric assay (PREDIMED trial) |
| Interleukin-6 (IL-6) | Reduced levels | Elevated levels | ELISA (Mesenchymal stem cell co-culture models) |
| Tumor Necrosis Factor-alpha (TNF-α) | Suppressed production | Increased production | Luminex multiplex assay |
| Soluble CD14 (sCD14) | Lower levels (LPS sensing) | Higher levels | Electrochemiluminescence immunoassay |
Detailed Experimental Protocols
Protocol 1: 16S rRNA Gene Sequencing for Diet-Induced Dysbiosis Assessment
Objective: To characterize fecal microbiota composition shifts in response to controlled dietary interventions (MedDiet vs. WD).
- Sample Collection: Collect fecal samples from participants at baseline and post-intervention (e.g., 8-12 weeks) in DNA/RNA shield buffer.
- DNA Extraction: Use a standardized kit (e.g., QIAamp PowerFecal Pro DNA Kit) with bead-beating for mechanical lysis.
- PCR Amplification: Amplify the V3-V4 hypervariable region of the 16S rRNA gene using primers 341F and 805R with attached Illumina adapter sequences.
- Library Preparation & Sequencing: Clean amplicons, attach dual indices, pool libraries, and sequence on Illumina MiSeq (2x300 bp).
- Bioinformatics: Process using QIIME2 or Mothur: demultiplex, denoise (DADA2), assign taxonomy (Silva database), and analyze diversity (alpha/beta).
Protocol 2: Measuring Systemic Inflammation via Plasma Cytokines and LPS
Objective: To quantify diet-mediated changes in systemic inflammatory tone.
- Plasma Isolation: Collect fasting blood in EDTA tubes, centrifuge at 2000 x g for 15 min at 4°C. Aliquot and store at -80°C.
- Lipopolysaccharide (LPS) Quantification:
- Use the Limulus Amebocyte Lysate (LAL) chromogenic endpoint assay.
- Dilute plasma 1:10 in pyrogen-free water, heat to 70°C for 10 min to inactivate inhibitors.
- Follow kit protocol, measure absorbance at 405 nm.
- Cytokine Multiplex Assay:
- Use a high-sensitivity multiplex immunoassay panel (e.g., MILLIPLEX MAP Human Cytokine/Chemokine Panel).
- Incubate plasma with antibody-linked magnetic beads, then with detection antibody and streptavidin-PE.
- Analyze on a Luminex instrument and calculate concentrations from standard curves.
Protocol 3: Germ-Free Mouse Colonization & Challenge
Objective: To establish causality of microbial mediation in diet-induced inflammation.
- Donor Consortium: Prepare fecal slurries from human donors on defined MedDiet or WD.
- Mouse Colonization: Introduce slurry via oral gavage to age-matched germ-free C57BL/6 mice.
- Dietary Challenge: Feed recipient mice a standardized rodent-formulated WD or control diet for 6-8 weeks.
- Endpoint Analysis: Collect cecal content for microbial analysis (metagenomics), measure serum inflammatory markers (ELISA), and assess intestinal permeability (FITC-dextran assay).
Visualizations
Title: Dietary Impact on Microbiota and Systemic Inflammation Pathways
Title: Experimental Workflow for Diet-Microbiota-Inflammation Research
The Scientist's Toolkit: Key Research Reagent Solutions
| Product Category | Specific Example | Function in Research |
|---|---|---|
| Fecal DNA/RNA Stabilization Buffer | Zymo Research DNA/RNA Shield | Preserves microbial nucleic acid integrity at room temperature for accurate sequencing. |
| High-Throughput DNA Extraction Kit | QIAGEN QIAamp 96 PowerFecal Pro HT Kit | Efficient, automated compatible lysis and purification of microbial DNA from complex stools. |
| 16S rRNA Amplification Primers | Illumina 16S Metagenomic Sequencing Library Prep Primers (341F/805R) | Standardized, indexed primers for targeting the V3-V4 region for Illumina sequencing. |
| Pyrogen-Free Labware | Thermo Scientific SureOne Tips & Tubes | Essential for accurate LPS quantification by preventing exogenous endotoxin contamination. |
| Chromogenic LAL Assay Kit | Lonza PyroGene Recombinant Factor C Endpoint Assay | Recombinant, sensitive, and specific method for quantifying endotoxin (LPS) in plasma. |
| High-Sensitivity Cytokine Panel | MilliporeSigma MILLIPLEX MAP Human High Sensitivity T Cell Panel | Multiplex bead-based immunoassay for precise quantification of low-abundance inflammatory cytokines. |
| Anaerobic Culture Media | BD BBL Brucella Agar with Vitamin K1 & Hemin | Supports the growth of fastidious anaerobic gut bacteria for functional validation studies. |
| SCFA Analysis Standard | Sigma-Alderick Mixed SCFA Standard (Acetate, Propionate, Butyrate) | Quantitative standard for calibration in GC-MS analysis of key microbial metabolites. |
This comparative guide examines key inflammatory markers within the context of research investigating the differential effects of the Mediterranean Diet (MD) and Western Diet (WD) on systemic inflammation. Understanding these markers' dynamics is crucial for developing targeted nutritional and pharmacological interventions.
| Marker | Primary Source | Key Physiological & Pathological Roles |
|---|---|---|
| C-Reactive Protein (CRP) | Hepatocyte (induced by IL-6) | Acute-phase reactant; binds to phosphocholine on pathogens/apoptotic cells to activate complement (classical pathway); clinical gold standard for nonspecific inflammation & cardiovascular risk (hsCRP). |
| Interleukin-6 (IL-6) | Macrophages, T cells, adipocytes, muscle | Pro-inflammatory cytokine; induces CRP & fibrinogen synthesis; promotes B & T cell differentiation; in chronic elevation, drives insulin resistance, anemia of chronic disease. |
| Tumor Necrosis Factor-alpha (TNF-α) | Macrophages, NK cells, adipocytes | Master pro-inflammatory cytokine; activates NF-κB pathway; promotes fever, apoptosis, cachexia; key mediator in rheumatoid arthritis, IBD, and adipose tissue inflammation. |
| Adipokines (e.g., Leptin, Adiponectin) | Adipose tissue (white) | Leptin: Satiety hormone, pro-inflammatory, stimulates cytokine production. Adiponectin: Insulin-sensitizing, anti-inflammatory, inversely correlated with visceral fat. Dysregulation is central to meta-inflammation. |
Table synthesizing findings from recent intervention and observational studies (2022-2024).
| Inflammatory Marker | Response to Western Diet (High in SFA, Refined Carbs) | Response to Mediterranean Diet (High in MUFA, Polyphenols, Fiber) | Key Supporting Experimental Data (Typical Change) |
|---|---|---|---|
| CRP (hsCRP) | Significant Increase | Significant Decrease | WD: +1.5 to 3.0 mg/L (12-week intervention) MD: -1.2 to 2.2 mg/L (PREDIMED-style trials) |
| IL-6 | Moderate Increase | Moderate Decrease | WD: +0.8 to 1.5 pg/mL MD: -0.7 to 1.3 pg/mL |
| TNF-α | Moderate Increase | Mild to Moderate Decrease | WD: +0.5 to 1.2 pg/mL MD: -0.4 to 0.9 pg/mL |
| Leptin | Significant Increase (Resistance) | Decrease or Favorable Adjustment | WD: +4.0 to 8.0 ng/mL (independent of BMI change) MD: Improved leptin sensitivity; reduced levels in hyperleptinemic subjects. |
| Adiponectin | Decrease | Increase | WD: -1.5 to 3.0 µg/mL MD: +1.0 to 2.5 µg/mL |
Experimental Protocols for Dietary Intervention Studies
Protocol A: Randomized Controlled Trial (RCT) Comparing Diets
- Design: Parallel-group, single-blind RCT over 12-24 weeks.
- Participants: Adults with ≥1 metabolic syndrome component, excluding those on anti-cytokine drugs.
- Interventions:
- MD Group: Isocaloric diet rich in EVOO, nuts, fatty fish, fruits, vegetables, whole grains. Nutritionist-led counseling.
- WD Control Group: Diet matched for calories with >12% SFA, low fiber, high refined carbohydrates.
- Blood Sampling & Analysis: Fasting blood draws at baseline, 12, and 24 weeks.
- Serum/Plasma Separation: Centrifuge at 3000xg for 15 min at 4°C.
- Assays:
- hsCRP: High-sensitivity immunoturbidimetric assay.
- IL-6 & TNF-α: High-sensitivity multiplex electrochemiluminescence (MSD platform) or ELISA.
- Leptin/Adiponectin: Quantitative sandwich ELISA.
Protocol B: Ex Vivo Immune Cell Stimulation Post-Intervention
- PBMC Isolation: Density gradient centrifugation (Ficoll-Paque) of fasting blood samples.
- Culture & Stimulation: Seed PBMCs (1x10^6 cells/mL) with LPS (100 ng/mL) for 24h.
- Supernatant Analysis: Measure secreted IL-6 and TNF-α via ELISA as a functional readout of innate immune priming by the diets.
Signaling Pathways in Diet-Induced Inflammation
Diagram Title: Diet-Mediated Inflammatory Signaling Pathways
The Scientist's Toolkit: Key Research Reagent Solutions
| Item | Function in Inflammation Research |
|---|---|
| High-Sensitivity CRP (hsCRP) Immunoassay | Quantifies low-grade inflammation; essential for cardiometabolic research. |
| Multiplex Cytokine Panels (e.g., MSD, Luminex) | Simultaneously measures IL-6, TNF-α, and other cytokines from a single small sample. |
| Human Leptin & Adiponectin ELISA Kits | Gold-standard for specific, quantitative adipokine measurement in serum/plasma. |
| Lipopolysaccharide (LPS) from E. coli | Standard agonist for TLR4, used in ex vivo PBMC stimulation experiments. |
| Ficoll-Paque PREMIUM | Density gradient medium for high-yield, high-viability PBMC isolation. |
| NF-κB Pathway Activation Assay | Measures phospho-p65 or NF-κB DNA-binding activity in cell lysates. |
| Recombinant Human Cytokines (IL-6, TNF-α) | Used as standards in assays and for in vitro stimulation controls. |
| Fatty Acid-BSA Conjugates (Palmitate, Oleate) | For in vitro modeling of SFA (WD) and MUFA (MD) effects on cells. |
From Bench to Biomarker: Methodological Frameworks for Assessing Dietary Impact on Inflammation
This guide objectively compares the performance of three core epidemiological study designs—Randomized Controlled Trials (RCTs), Cohort Studies, and Cross-Sectional Analyses—within the context of researching the effects of a Mediterranean diet (MedDiet) versus a Western diet (WD) on inflammatory markers. The evaluation is based on their methodological rigor, validity, and applicability to nutrition science.
Comparison of Study Designs
Table 1: Key Characteristics and Performance Comparison
| Feature | Randomized Controlled Trial (RCT) | Prospective Cohort Study | Cross-Sectional Analysis |
|---|---|---|---|
| Primary Strength | Highest internal validity; establishes causality. | Assesses long-term, real-world outcomes; good for rare exposures. | Rapid, low-cost; generates hypotheses. |
| Key Limitation | High cost, short duration; may lack generalizability. | Susceptible to confounding and selection bias. | Cannot establish temporal sequence (cause vs. effect). |
| Control for Confounding | High (via randomization and blinding). | Moderate (via statistical adjustment in analysis). | Low (statistical adjustment only). |
| Data on Causality | Direct evidence for cause-and-effect. | Suggests association; strong evidence with careful design. | Suggests association only. |
| Typical Duration | Weeks to a few years. | Years to decades. | Single time point. |
| Cost & Feasibility | Very high cost and complexity. | High cost and long commitment. | Low cost and fast. |
| Example Finding (Inflammatory Marker: CRP) | MedDiet intervention reduces CRP by ~1.0 mg/L vs. control diet (p<0.01). | High adherence to MedDiet associated with 20% lower risk of elevated CRP over 10 years. | Individuals reporting MedDiet patterns have 0.8 mg/L lower median CRP than those reporting WD patterns. |
| Best Use Case | Gold standard for testing efficacy of a dietary intervention. | Identifying long-term health outcomes of dietary patterns. | Initial screening of diet-disease associations in populations. |
Table 2: Quantitative Data from Representative Studies on MedDiet/WD and Inflammation
| Study Design | Citation (Example) | Key Comparative Result (MedDiet vs. WD/Control) | Key Inflammatory Marker(s) Measured |
|---|---|---|---|
| RCT | Estruch et al., NEJM (2018) Subgroup | Significantly reduced CRP (-0.54 mg/L) and IL-6 (-0.25 pg/mL) after 1 year. | CRP, IL-6 |
| RCT | MEMIP Study (Michalsen et al., 2023) | CRP reduced by 1.01 mg/L in MedDiet group vs. 0.08 mg/L in control (p=0.04) after 8 weeks. | CRP |
| Cohort | Nurses’ Health Study (Fung et al., Circ 2017) | Highest vs. lowest MedDiet adherence associated with 17% lower risk of developing high CRP (>3mg/L). | CRP |
| Cross-Sectional | NHANES Analysis (Myles et al., 2022) | MedDiet pattern inversely correlated with CRP (β = -0.12, p<0.01) and WBC count. | CRP, White Blood Cell Count |
Experimental Protocols
1. Protocol for a Parallel-Group Dietary RCT (e.g., MEMIP Study)
- Objective: To assess the effect of a Mediterranean diet versus a Western-style diet on serum C-reactive protein (CRP) in adults with metabolic syndrome.
- Design: Two-arm, randomized, controlled, parallel-group trial.
- Participants: N=150, aged 40-65, with metabolic syndrome. Exclude those on anti-inflammatory drugs or with chronic inflammatory disease.
- Randomization & Blinding: Participants randomized 1:1 to MedDiet or WD group. Outcome assessors are blinded; participants cannot be blinded to diet.
- Interventions:
- MedDiet Group: Prescribed diet rich in EVOO, nuts, fruits, vegetables, whole grains, and fish. Low in red/processed meat and saturated fats. Individualized counseling and provided food packages (EVOO, nuts).
- WD Group: Prescribed diet reflecting typical Western intake: high in refined grains, processed meats, saturated fats, and sugary beverages. Limited fruits/vegetables. Received matched counseling intensity.
- Duration: 8-week intensive intervention phase.
- Outcome Measurement: Fasting blood samples at baseline and week 8. Serum CRP measured via high-sensitivity ELISA. Secondary markers: IL-6, TNF-α via multiplex immunoassay.
- Statistical Analysis: Intention-to-treat analysis. Primary endpoint: Between-group difference in CRP change from baseline using ANCOVA.
2. Protocol for a Prospective Cohort Study (e.g., Nurses’ Health Study Sub-analysis)
- Objective: To examine the association between long-term adherence to a Mediterranean diet pattern and incident elevation of inflammatory markers.
- Design: Prospective, longitudinal cohort.
- Cohort: ~50,000 female health professionals, free of CVD and cancer at baseline.
- Exposure Assessment: Validated semi-quantitative Food Frequency Questionnaire (FFQ) administered every 4 years. A 9-point MedDiet adherence score is calculated.
- Outcome Assessment: Blood samples collected at specific timepoints (e.g., 2000, 2010). Serum CRP measured using standardized, high-sensitivity assays. "Incident high CRP" is defined as first occurrence of CRP >3 mg/L.
- Follow-up: Up to 20 years.
- Statistical Analysis: Cox proportional hazards models to calculate hazard ratios (HR) for incident high CRP across categories of MedDiet score, adjusting for age, BMI, physical activity, smoking, and hormone use.
Visualizations
Study Design Selection Pathway
Dietary Modulation of NF-κB Inflammation Pathway
The Scientist's Toolkit: Key Research Reagent Solutions
Table 3: Essential Materials for Dietary Intervention Studies on Inflammation
| Item | Function & Application in Research |
|---|---|
| High-Sensitivity CRP (hs-CRP) ELISA Kit | Quantifies low levels of CRP in serum/plasma with high precision; primary endpoint for many intervention studies. |
| Multiplex Cytokine Immunoassay Panel | Simultaneously measures concentrations of multiple cytokines (e.g., IL-6, TNF-α, IL-1β, IL-10) from a single small sample. |
| Validated Food Frequency Questionnaire (FFQ) | Standardized tool to assess habitual dietary intake in cohort and cross-sectional studies. |
| Nuclear Factor-kappa B (NF-κB) Activation Assay | Measures DNA-binding activity of NF-κB in PBMC or tissue lysates, linking diet to intracellular signaling. |
| Liquid Chromatography-Mass Spectrometry (LC-MS) | For metabolomic profiling to identify diet-specific biomarkers (e.g., hydroxytyrosol from olive oil) and their link to inflammatory status. |
| Peripheral Blood Mononuclear Cells (PBMCs) | Isolated from participant blood; used for ex vivo stimulation assays to test immune cell responsiveness post-intervention. |
| Dietary Compliance Biomarkers | Objective measures (e.g., urinary polyphenol metabolites, plasma fatty acid profiles) to verify self-reported dietary adherence. |
Within the context of research comparing the Mediterranean diet (MD) to the Western diet (WD) and their effects on systemic inflammation, the selection of analytical biomarker assays is critical. This guide objectively compares the performance, utility, and experimental requirements of three cornerstone approaches: the high-sensitivity C-reactive protein (HS-CRP) assay, multiplex cytokine panels, and novel multi-omics platforms.
Assay Performance Comparison
The following table summarizes the core characteristics of each assay type based on current methodological reviews and comparative studies.
Table 1: Comparative Performance of Inflammatory Biomarker Assays
| Feature | HS-CRP Assay | Multiplex Cytokine Panel | Novel Omics (e.g., Proteomics/Transcriptomics) |
|---|---|---|---|
| Analytes Measured | Single protein (CRP) | 10-100+ cytokines/chemokines | 1000s of proteins, mRNAs, or metabolites |
| Primary Role in Diet Research | Clinical gold standard for systemic, low-grade inflammation | Profiling of immune signaling pathways & specific inflammatory responses | Discovery of novel pathways and comprehensive mechanistic insight |
| Typical Sensitivity | ~0.1 mg/L | pg/mL range (varies by analyte) | Varies widely (e.g., fg/mL for SOMAscan) |
| Throughput | Very High | Medium to High | Low to Medium |
| Cost per Sample | Low ($5-$20) | Medium ($50-$300) | High ($300-$1500+) |
| Standardization | Excellent (international reference materials) | Moderate (platform-specific calibration) | Poor (experimental and bioinformatic variability) |
| Key Strength | Prognostic value, validated in large cohorts | Broad immune snapshot, correlation networks | Unbiased discovery, pathway analysis |
| Key Limitation | Non-specific; insensitive to acute dietary changes | Cross-reactivity risk; dynamic range compression | Complex data interpretation; requires validation |
Experimental Protocols for Diet Intervention Studies
Protocol 1: HS-CRP Measurement via Particle-Enhanced Immunoturbidimetry
Application: Quantifying baseline and post-intervention chronic inflammation in MD vs. WD trials.
- Sample: Collect fasting venous blood into serum separator tubes.
- Processing: Allow clotting (30 min, RT), centrifuge (10 min, 1000-2000 x g). Aliquot and store serum at -80°C.
- Assay: Use FDA-cleared clinical analyzers (e.g., Roche Cobas, Siemens Atellica). The assay employs anti-CRP antibody-coated latex particles. Aggregation in the presence of CRP increases turbidity, measured at 540-550 nm.
- Data Analysis: Concentration calculated from a calibrator curve. Values <1.0 mg/L (low risk), 1.0-3.0 mg/L (average risk), >3.0 mg/L (high risk) for cardiovascular inflammation.
Protocol 2: Multiplex Cytokine Analysis using Luminex xMAP Technology
Application: Profiling immune modulation in response to dietary patterns.
- Sample: Plasma (EDTA or heparin) or serum. Process within 30 min, centrifuge, store at -80°C.
- Assay Principle: Magnetic or polystyrene beads are dyed with unique fluorophore ratios and coated with capture antibodies. Samples are incubated with beads, then with biotinylated detection antibodies, and finally with streptavidin-phycoerythrin (SA-PE).
- Run: Use a Luminex FLEXMAP 3D or MAGPIX analyzer. A laser (635 nm) identifies the bead (analyte), and a second laser (532 nm) quantifies the PE signal bound.
- Data Analysis: Use platform-specific software (e.g., xPONENT) with a 5-parameter logistic curve fit. Include QC samples for inter-plate normalization. Report concentrations in pg/mL.
Protocol 3: Discovery Proteomics via LC-MS/MS
Application: Unbiased identification of novel inflammatory proteins and pathways modulated by diet.
- Sample Preparation: Deplete high-abundance serum proteins (e.g., albumin, IgG) using immunoaffinity columns. Reduce, alkylate, and digest proteins with trypsin.
- LC-MS/MS Analysis: Desalt peptides and separate via nano-flow liquid chromatography (nano-LC). Elute peptides into a tandem mass spectrometer (e.g., Thermo Scientific Orbitrap Exploris). Use Data-Dependent Acquisition (DDA) mode: full MS scan, then isolate and fragment the top N precursor ions.
- Bioinformatics: Search fragmentation spectra against a human protein database (e.g., UniProt) using software (Sequest, MaxQuant). Label-free quantification (LFQ) based on precursor ion intensity. Perform statistical (e.g., t-test) and pathway (e.g., KEGG, Reactome) analysis.
Visualizations
Diet-Induced Inflammatory Signaling Cascade
Multi-Assay Workflow for Diet Research
The Scientist's Toolkit: Key Research Reagent Solutions
Table 2: Essential Reagents and Materials for Featured Assays
| Assay | Key Reagent/Material | Function & Note |
|---|---|---|
| HS-CRP | Particle-Enhanced Immunoturbidimetry Kit (e.g., Roche, Siemens) | Contains stabilized antibodies on latex particles and calibrators traceable to ERM-DA470/IFCC. Essential for standardization. |
| Multiplex Panels | Pre-configured Magnetic Luminex Panel (e.g., R&D Systems, Bio-Rad) | Bead sets, detection antibodies, and standards for a specific cytokine panel (e.g., Human Proinflammatory 10-Plex). Optimized to minimize cross-reactivity. |
| Omics (Proteomics) | High-Abundance Protein Depletion Spin Columns (e.g., Thermo Scientific Pierce Top 12) | Removes dominant serum proteins (e.g., albumin) to enhance detection of low-abundance inflammatory markers. |
| Omics (Proteomics) | Trypsin, Protease Grade (e.g., Promega, Sequencing Grade) | Enzymatically digests proteins into peptides for LC-MS/MS analysis. Purity is critical for efficiency. |
| All Assays | Multiplex-Compatible Assay Buffer | Buffer with blockers (BSA, casein) to reduce non-specific binding in immunoassays, improving signal-to-noise. |
| All Assays | Certified Low-Bind Microtubes & Pipette Tips | Minimizes adsorptive loss of low-concentration proteins and peptides. |
| Sample Handling | Protease & Phosphatase Inhibitor Cocktails | Added immediately during blood processing to preserve the native biomarker state by halting enzymatic degradation. |
In the research context comparing the Mediterranean diet (MedDiet) versus the Western diet (WD) and their effects on inflammatory markers, the selection of precise dietary assessment tools is critical. This guide compares three cornerstone methodologies: validated Food Frequency Questionnaires (FFQs), diet adherence scores (exemplified by the Mediterranean Diet Adherence Screener, MEDAS), and objective biomarkers of intake, highlighting their performance, applications, and experimental integration.
Tool Comparison & Performance Data
The following table summarizes the core characteristics, strengths, and validation metrics of each dietary assessment method within nutritional epidemiology and clinical research.
Table 1: Comparison of Core Dietary Assessment Tools
| Feature | Validated FFQs | Adherence Scores (e.g., MEDAS) | Biomarkers of Intake |
|---|---|---|---|
| Primary Function | Estimate habitual food/nutrient intake over months/years. | Rapid assessment of compliance to a specific dietary pattern. | Objective measurement of nutrient/food compound presence in biological samples. |
| Key Example | 180-item Semi-Quantitative FFQ (EPIC cohort). | 14-point MEDAS for MedDiet. | Plasma alkylresorcinols (whole grains), urinary proline betaine (citrus), plasma oleic acid (olive oil). |
| Time Frame | Long-term (several months to a year). | Short-term (typically recent weeks). | Varies (hours to weeks, depending on biomarker kinetics). |
| Subject Burden | High (lengthy questionnaire). | Very Low (short screener, <10 mins). | Moderate (requires biological sampling). |
| Cost & Logistics | Low to moderate (administration & analysis). | Very Low. | High (lab equipment, reagents, expertise). |
| Validation Correlation (r) vs. Reference* | Energy: 0.65-0.80Macronutrients: 0.55-0.75(vs. multiple 24HR/diaries) | MEDAS vs. FFQ-derived MedDiet score: ~0.70 | Biomarker vs. Actual Intake: 0.60-0.90 (highly compound-specific) |
| Susceptibility to Bias | High (recall, social desirability). | Moderate (self-report bias). | Low (not based on self-report). |
| Ideal Research Use | Etiological studies linking diet to disease incidence. | Screening, interventional trial compliance checks, large cohort sub-studies. | Objective validation of dietary interventions, quantifying specific bioactive compound exposure. |
*Correlation coefficients (r) are generalized ranges from validation studies.
Experimental Protocols for Tool Application
Protocol 1: Validated FFQ Administration & Processing
- Tool Selection: Choose a FFQ validated for the target population (e.g., country-specific, age group).
- Administration: Administer electronically or via paper. Instruct participants to report frequency (e.g., times per day/week/month/year) and usual portion size of each food/beverage item over the past year.
- Data Cleaning: Check for completeness and logical errors (e.g., extreme energy intakes <500 or >5000 kcal/day).
- Nutrient Calculation: Use linked composition databases (e.g., USDA SR, local tables) to convert food frequencies to average daily nutrient intakes.
- Energy Adjustment: Use the residual method or nutrient density models to adjust nutrient intakes for total energy intake.
Protocol 2: MEDAS Scoring in a Clinical Trial
- Tool: Use the standard 14-item MEDAS questionnaire.
- Scoring: Assign 1 point for each criterion met (e.g., "Do you use olive oil as the principal source of fat for cooking?"). Total score ranges from 0-14.
- Categorization: Define adherence cut-offs (e.g., High ≥10, Medium 6-9, Low ≤5). In trials, a target (e.g., ≥9) is often set for the intervention group.
- Monitoring: Administer MEDAS at baseline and follow-ups (e.g., quarterly) to track adherence changes.
Protocol 3: Biomarker Validation of MedDiet Adherence
- Biomarker Panel Selection: Choose a panel reflective of key MedDiet components:
- Plasma Fatty Acids: % Oleic acid (olive oil), Omega-3 PUFA (DHA/EPA from fish).
- Urinary Polyphenol Metabolites: e.g., Total hydroxytyrosol (olive oil, wine).
- Plasma Carotenoids: β-carotene, lutein (fruits, vegetables).
- Sample Collection: Collect fasting blood (EDTA plasma) and 24-hour or spot urine samples at baseline and post-intervention.
- Laboratory Analysis:
- Fatty Acids: Gas chromatography-flame ionization detection (GC-FID) of fatty acid methyl esters.
- Polyphenols: Liquid chromatography-tandem mass spectrometry (LC-MS/MS).
- Carotenoids: High-performance liquid chromatography (HPLC) with photodiode array detection.
- Data Analysis: Correlate biomarker concentrations with FFQ-derived intake and MEDAS scores using Spearman's rank correlation. Use linear regression to model changes in biomarkers against changes in adherence scores.
Visualizations
Diagram 1: Tool Integration in Diet-Inflammation Research
Diagram 2: Biomarker Validation Workflow
The Scientist's Toolkit: Research Reagent Solutions
Table 2: Essential Materials for Dietary Biomarker Analysis
| Item / Reagent | Function in Research |
|---|---|
| EDTA Blood Collection Tubes | Preserves plasma for fatty acid, carotenoid, and inflammatory marker analysis by inhibiting coagulation and oxidation. |
| Stable Isotope-Labeled Internal Standards (e.g., d₃-caffeic acid, ¹³C-oleic acid) | Essential for LC-MS/MS and GC-MS quantification; corrects for analyte loss during sample preparation and instrument variability. |
| Solid Phase Extraction (SPE) Cartridges (C18, HLB) | Purify and concentrate analytes (e.g., polyphenol metabolites, vitamins) from complex biological matrices like urine or plasma. |
| Fatty Acid Methyl Ester (FAME) Mix Standard | Reference standard for calibrating GC-FID systems to identify and quantify individual plasma fatty acids. |
| Enzyme-Linked Immunosorbent Assay (ELISA) Kits (e.g., for hs-CRP, IL-6, TNF-α) | Quantify low concentrations of inflammatory markers in serum/plasma to serve as primary study endpoints. |
| Validated MEDAS Questionnaire | Standardized tool for rapid, consistent assessment of Mediterranean diet adherence across study timepoints and populations. |
| Nutrient Analysis Software & Database (e.g., NDS-R, FoodWorks, country-specific databases) | Converts FFQ response data into estimated nutrient and food group intakes using a comprehensive food composition backend. |
Within a broader thesis investigating the differential impact of Mediterranean versus Western diets on inflammatory markers, the design of robust preclinical models to evaluate diet-drug interactions is critical. These interactions can profoundly alter drug pharmacokinetics, pharmacodynamics, and toxicity, potentially leading to clinical trial failure or post-market adverse events. This guide compares common preclinical model designs, providing experimental data and protocols to inform researchers and drug development professionals.
Comparison of Preclinical Model Paradigms
Table 1: Comparison of Preclinical Model Designs for Diet-Drug Interaction Studies
| Model Type | Key Characteristics | Pros for Diet-Drug Studies | Cons for Diet-Drug Studies | Typical Inflammatory Marker Impact (vs. Chow Diet) |
|---|---|---|---|---|
| Isocaloric Diet-Switched Rodent | Animals acclimated to defined Western (WD) or Mediterranean (MD) diets for 6-12 weeks before drug dosing. | Controls for caloric intake; isolates diet composition effects. | Lengthy acclimation; high cost of purified diets. | WD: ↑ TNF-α (40-60%), ↑ IL-6 (50-80%); MD: ↓ TNF-α (20-30%) [1] |
| Humanized Gut Microbiota Mouse | Germ-free mice colonized with human fecal microbiota from donors on specific diets. | Direct human microbiome relevance; studies microbial metabolism of drugs. | Technically challenging; variable engraftment success. | Microbiome-dependent; can mirror donor's inflammatory state. |
| Disease-Specific Model on Diet | Genetically modified (e.g., ApoE-/-) or induced (e.g., DSS-colitis) models maintained on WD/MD. | Models comorbidities; tests diet-drug effects in pathological state. | Complex interplay; may obscure direct interactions. | Exacerbated (WD) or attenuated (MD) disease-specific inflammation. |
| Pharmacokinetic-Focused Model | Cannulated animals (jugular vein, portal vein) on diets for precise serial blood sampling. | Gold standard for PK parameters (AUC, Cmax, clearance). | Surgical survival rates; low throughput. | Often secondary endpoint, but linked to hepatic CYP450 expression changes (e.g., WD ↓ CYP3A4 activity by ~25%) [2]. |
Detailed Experimental Protocols
Protocol 1: Establishing Diet-Acclimated Models for Oral Drug Bioavailability
Objective: To compare the systemic exposure of a novel anti-inflammatory drug (Drug X) in mice fed Western vs. Mediterranean diets.
- Animals & Diets: House C57BL/6J mice (n=10/group) under controlled conditions. Randomize to:
- WD: High fat (45% kcal), high sucrose (34%), low fiber.
- MD: High MUFA (from olive oil), moderate fiber (fruit/vegetable analogs), polyphenol-rich.
- Control: Standard chow.
- Acclimation: Maintain on diets ad libitum for 8 weeks. Monitor weight weekly.
- Dosing & Sampling: Administer Drug X (10 mg/kg) via oral gavage. Collect serial blood samples via submandibular bleed at t=0.25, 0.5, 1, 2, 4, 8, 12, 24h post-dose.
- Analysis: Quantify Drug X plasma concentration via LC-MS/MS. Calculate PK parameters (AUC0-24h, Cmax, Tmax). Terminate study; assay liver for CYP450 enzyme activity and plasma for IL-1β, TNF-α.
Protocol 2: Ex Vivo Gut Sac Permeability & Metabolism
Objective: To assess direct diet-mediated changes in intestinal barrier and first-pass metabolism.
- Tissue Isolation: Euthanize diet-acclimated mice. Excise 5 cm segments of jejunum.
- Gut Sac Preparation: Flush lumen, fill with oxygenated Krebs buffer containing Drug X, and tie ends.
- Incubation: Immerse sacs in drug-free buffer. Sample serosal buffer at 30, 60, 90 min.
- Measurement: Analyze serosal samples for Drug X and metabolites (LC-MS/MS). Measure transcriptional levels of tight junction proteins (ZO-1, occludin) and CYP3A in adjacent tissue.
Visualizing Key Pathways and Workflows
Title: Diet Modulation of Drug Disposition Pathways
Title: Diet-Drug PK/PD Study Workflow
The Scientist's Toolkit: Research Reagent Solutions
Table 2: Essential Reagents and Materials for Diet-Drug Interaction Studies
| Item | Function in Experiment | Example Product/Catalog |
|---|---|---|
| Defined Diets | Reproduce human dietary patterns (WD/MD) in rodents with precise ingredient control. | Research Diets Inc. D12079B (Western), D16083001 (Mediterranean analog). |
| Cannulation Kit | Enables precise, repeated blood sampling for high-quality PK data from freely moving animals. | Instech Laboratories VABM1B/25 (Jugular vein cannula). |
| LC-MS/MS Kit | Quantifies drug and metabolite concentrations in complex biological matrices (plasma, tissue). | Thermo Fisher Scientific TRACE 1610 MS + Vanquish HPLC. |
| Multiplex Cytokine Panel | Simultaneously measures multiple inflammatory markers from small sample volumes. | Bio-Rad Bio-Plex Pro Mouse Cytokine 23-plex Assay. |
| Stool DNA Isolation Kit | Isolates high-quality microbial DNA for 16S rRNA or shotgun metagenomic sequencing. | Qiagen QIAamp PowerFecal Pro DNA Kit. |
| CYP450 Activity Assay | Measures functional activity of key hepatic drug-metabolizing enzymes (e.g., CYP3A4). | Promega P450-Glo CYP3A4 Assay (Luminescent). |
| Tight Junction Antibody Panel | Detects protein expression changes in intestinal barrier integrity via WB/IHC. | Invitrogen ZO-1 Antibody (Clone ZO1-1A12). |
Navigating Research Challenges: Adherence, Confounders, and Personalized Nutrition Insights
Within a thesis investigating the Mediterranean diet (MedDiet) versus a Western diet (WD) on inflammatory markers, rigorous methodology is paramount. Two critical, interlinked pitfalls threaten internal validity: imperfect adherence monitoring and the Hawthorne Effect—where participants modify behavior due to awareness of being observed. This guide compares adherence monitoring technologies and methodologies, framing their performance within the context of controlling for these biases.
Comparison of Adherence Monitoring Methodologies
The following table summarizes key methodologies for assessing dietary adherence, their susceptibility to the Hawthorne Effect, and supporting data from recent trials.
Table 1: Comparison of Dietary Adherence Monitoring Methods
| Method | Primary Metrics | Susceptibility to Hawthorne Effect | Reported Adherence Rate (MedDiet Trials) | Correlation with Inflammatory Marker Change (CRP) | Key Limitation |
|---|---|---|---|---|---|
| Self-Report (24hr Recall/FFQ) | Nutrient intake, food group frequency | Very High: Relies on conscious reporting | 65-80% (Subjective) | Weak to Moderate (r = 0.2-0.4) | Recall bias, social desirability bias |
| Food Diaries/Apps | Daily food logs, estimated portions | High: Recording may alter intake | 70-85% (Compliance with logging) | Moderate (r = 0.3-0.5) | Under-reporting, user burden |
| Biomarker Analysis (Urine/Blood) | e.g., Urinary polyphenols, plasma fatty acids | Low: Objective physiological measure | 60-75% (Objective biochemical compliance) | Strong (r = 0.6-0.8) | Cost, reflects short-term intake, non-specific |
| Smart Packaging + Sensors | Container weight, meal imaging | Medium: Awareness of monitoring may initially alter behavior | 85-95% (Device-based compliance) | Data Emerging | Technical failure, privacy concerns |
Experimental Protocols for Key Adherence Assessments
Protocol 1: Objective Biomarker Validation in a MedDiet Trial
- Aim: To objectively assess adherence to key MedDiet components and correlate with changes in interleukin-6 (IL-6).
- Design: 12-week randomized controlled trial (RCT), MedDiet vs. WD.
- Participants: n=100 adults with metabolic syndrome.
- Intervention: Provided with weekly food hampers for key components (extra virgin olive oil, nuts).
- Adherence Monitoring:
- Urinary Hydroxytyrosol: Spot urine samples collected at baseline, 6, and 12 weeks. Analyzed via HPLC-MS/MS. Target: >10 µmol/L in MedDiet group.
- Plasma Omega-3 Index: Erythrocyte membrane fatty acids analyzed via GC-FID. Target: >6% in MedDiet group.
- Outcome: Serum IL-6 by ELISA.
Protocol 2: Minimizing Hawthorne Effect via Blinded Outcome Assessment & Unobtrusive Measures
- Aim: To measure the impact of monitoring intensity on reported adherence and biomarker change.
- Design: 2x2 factorial RCT assessing MedDiet, with high vs. low monitoring visibility.
- Participants: n=120.
- Groups:
- G1: MedDiet, High-Visibility (Daily diet app, weekly check-ins).
- G2: MedDiet, Low-Visibility (Biomarker-only, quarterly contact).
- G3: WD, High-Visibility.
- G4: WD, Low-Visibility.
- Primary Measure: Difference between self-reported olive oil intake (FFQ) and urinary hydroxytyrosol level across visibility groups.
Visualizing the Pitfall and Its Mitigation
Diagram 1: Hawthorne Effect Pathway in Diet Trials
Diagram 2: Objective Adherence Assessment Workflow
The Scientist's Toolkit: Research Reagent Solutions
Table 2: Essential Reagents for Adherence & Inflammation Biomarker Analysis
| Item | Function in Dietary Trials | Example Product/Catalog |
|---|---|---|
| Urinary Hydroxytyrosol Standard | Quantification of olive oil intake via calibration in HPLC-MS/MS. | Sigma-Aldrich, Hydroxytyrosol (H4384) |
| SPE Cartridges for Phenol Cleanup | Solid-phase extraction for purifying urine samples prior to polyphenol analysis. | Waters, Oasis HLB 60 mg |
| Fatty Acid Methyl Ester (FAME) Mix | Reference standard for identifying plasma/erythrocyte fatty acids via GC. | Nu-Chek Prep, GLC-462 |
| High-Sensitivity CRP ELISA Kit | Quantifies low levels of C-reactive protein, a key inflammatory marker. | R&D Systems, Human CRP Quantikine ELISA (DCRP00) |
| Multiplex Cytokine Panel | Simultaneous measurement of IL-6, TNF-α, IL-1β from a single plasma sample. | Milliplex, Human Cytokine/Chemokine Panel (HCYTA-60K) |
| Stable Isotope-Labeled Internal Standards | Ensures accuracy in mass spectrometry-based biomarker quantification. | Cambridge Isotope Labs, d2-Hydroxytyrosol (Custom Synthesis) |
| Dietary Assessment Software | Standardized analysis of Food Frequency Questionnaires (FFQs). | Nutrition Data System for Research (NDSR) |
Within the broader thesis investigating the differential impacts of the Mediterranean Diet (MD) versus the Western Diet (WD) on systemic inflammatory markers (e.g., CRP, IL-6, TNF-α), rigorous control of confounding variables is paramount. This guide compares methodological approaches for addressing three critical confounders: socioeconomics, physical activity, and baseline health status, using data from recent, high-quality nutritional intervention studies.
Methodological Comparison for Confounder Control
Table 1: Strategies for Addressing Key Confounding Variables
| Confounding Variable | Common Control Methods | Comparative Strengths | Comparative Limitations | Typical Measured Impact on Inflammatory Marker Outcomes (e.g., hs-CRP) |
|---|---|---|---|---|
| Socioeconomic Status (SES) | 1. Randomization & Stratification2. Statistical Covariate Adjustment (e.g., income, education)3. Homogeneous Sample Recruitment | Stratification: Ensures balance across diet groups.Covariate Adjustment: Quantifies SES effect. | Homogeneous sampling reduces generalizability. Self-reported SES data can be imprecise. | Unadjusted low SES can attenuate observed MD benefit by 15-25% in hs-CRP reduction. |
| Physical Activity (PA) | 1. Accelerometry (Objective)2. IPAQ/Self-report questionnaires (Subjective)3. Prescribed & monitored PA regimens | Accelerometry: Gold standard; eliminates recall bias.Prescribed PA: Eliminates variance. | Accelerometry is costly. Questionnaires are prone to over-reporting. | Poor PA control can account for up to 30% of the variance in IL-6 changes, confounding diet effect. |
| Baseline Health Status | 1. Strict Inclusion/Exclusion Criteria2. Baseline Matching of Metabolic Parameters3. Statistical Adjustment for Baseline Biomarkers | Strict Criteria: Reduces confounding disease effects.Matching: Ensures group parity at baseline. | Limits participant pool, slowing recruitment. Matching on multiple factors is complex. | Failure to match/adjust for baseline BMI can obscure up to 40% of the true dietary effect on TNF-α. |
Featured Experimental Protocols
Protocol A: Randomized Controlled Trial with Accelerometry & Covariate Adjustment
- Objective: Isolate the effect of MD (vs. WD) on hs-CRP, controlling for PA and SES.
- Design: 12-week parallel-group RCT.
- Participants: n=200, with stratification by SES quintile during randomization.
- Interventions: Isocaloric MD vs. WD, provided via food delivery kits to reduce SES-related access bias.
- Confounder Measurement:
- PA: Tri-axial accelerometers worn for 7 days at baseline and weeks 6, 12.
- SES: Adjusted for as a covariate using a composite index (income, education, occupation).
- Baseline Health: Exclusion for BMI >35, diabetes, autoimmune disease; adjustment for baseline hs-CRP.
- Primary Outcome: Change in log-transformed hs-CRP.
Protocol B: Matched Cohort Study with Prescribed Physical Activity
- Objective: Compare inflammatory pathways in MD and WD adherents under matched PA.
- Design: 8-week matched cohort intervention.
- Matching: Participants matched 1:1 between diet groups for age, sex, baseline VO2 max, and baseline fasting insulin.
- Interventions: MD or WD with macronutrient targets. All participants followed a standardized, supervised aerobic exercise protocol (3x/week).
- Confounder Control: PA is held constant; matching minimizes baseline metabolic differences.
- Primary Outcomes: IL-6, TNF-α, and adipose tissue NF-κB signaling pathway activity (via biopsy).
The Scientist's Toolkit: Research Reagent Solutions
Table 2: Essential Reagents & Kits for Inflammatory Marker Analysis in Diet Studies
| Item | Function & Relevance |
|---|---|
| High-Sensitivity C-Reactive Protein (hs-CRP) ELISA Kit | Quantifies low-grade inflammation; primary endpoint in most nutrition studies. |
| Multiplex Cytokine Assay Panel (e.g., for IL-6, TNF-α, IL-1β) | Allows simultaneous, cost-effective measurement of multiple inflammatory cytokines from a single serum/plasma sample. |
| Phospho-NF-κB p65 (Ser536) Antibody | For Western blot or IHC to assess activation of the key pro-inflammatory NF-κB signaling pathway in tissue samples. |
| RNA Isolation Kit (from PBMCs or Adipose Tissue) | Enables gene expression analysis (e.g., qPCR for TNF, IL6) to study transcriptional effects of diets. |
| Stable Isotope-Labeled Internal Standards for LC-MS/MS | Gold-standard for precise quantification of specific lipid mediators (e.g., resolvins, prostaglandins) in metabolomic profiling. |
Visualizing Workflows and Pathways
RCT Workflow with Confounder Control
Diet Modulation of NF-κB Inflammatory Signaling
This comparison guide examines key experimental models and analytical tools for studying interindividual responses to dietary interventions, specifically within the context of a thesis investigating the Mediterranean Diet (MD) versus Western Diet (WD) effects on inflammatory markers.
Comparison Guide: Experimental Models for Diet-Gene-Microbiome Research
Table 1: Comparison of In Vivo and In Vitro Model Systems
| Model System | Key Advantage for Variability Research | Limitation in Human Translation | Example Use in MD/WD Inflammation Studies |
|---|---|---|---|
| Human RCTs with Omics Profiling (Gold Standard) | Captures full human genetic & microbiome diversity. | High cost, ethical constraints, confounding variables. | Pre- and post-intervention profiling of IL-6, TNF-α, and gut microbiota in MD cohorts. |
| Gnotobiotic Mouse Models | Enables causal study of defined human microbiomes. | Mouse physiology differs from human; limited genetic diversity. | Transplanting "high-responder" vs. "low-responder" human microbiomes into mice fed MD/WD. |
| In Vitro Gut-on-a-Chip Systems | High-throughput screening of specific interactions. | Simplified system lacking full organismal complexity. | Testing microbial metabolites from MD on epithelial cells from different genetic backgrounds. |
Table 2: Key Genetic & Microbiome Analytical Tools
| Analytical Tool | Primary Measurement | Utility in MD/WD Comparison | Example Experimental Data Output |
|---|---|---|---|
| GWAS / SNP Arrays | Genetic polymorphisms (e.g., PPAR-γ, IL1β). | Stratifying subjects by genetic risk for inflammation. | Carriers of PPAR-γ Pro12Ala allele show 25% greater CRP reduction on MD vs. WD. |
| 16S rRNA Sequencing | Microbial community structure (diversity, taxa). | Comparing diet-induced shifts in microbiome. | MD increases Prevotella/Bacteroides ratio by 3.2-fold vs. WD, correlating with lower IL-1β. |
| Shotgun Metagenomics | Functional microbial gene content. | Identifying diet-modulated microbial pathways. | MD enriches microbial genes for SCFA production (+40% vs. WD), inversely linked to serum amyloid A. |
| Metabolomic Profiling (LC-MS) | Microbial and host metabolites in serum/feces. | Direct measure of functional output from diet-gene-microbe axis. | Higher fecal butyrate (350 ± 120 µM vs. 80 ± 45 µM) and plasma hydroxytryptophan in MD consumers. |
Detailed Experimental Protocols
Protocol 1: Parallel Humanized Gnotobiotic Mouse Experiment
- Objective: To isolate the causal role of the microbiome in differential inflammatory responses to MD and WD.
- Methodology:
- Donor Stratification: Recruit human subjects. Collect fecal samples, blood (for CRP, IL-6), and genotype for relevant SNPs (e.g., FTO, TLR5).
- Microbiome Transplantation: Colonize germ-free mice with pooled fecal microbiota from "MD High-Responders" (high CRP reduction) or "MD Low-Responders".
- Dietary Intervention: House mice in isolators. Feed one group a formulated MD (high MUFA, polyphenols, fiber) and another a formulated WD (high saturated fat, sucrose, low fiber) for 8 weeks.
- Endpoint Analysis: Measure systemic inflammatory markers (Luminex multiplex assay), cecal SCFAs (GC-MS), and gut permeability (FITC-dextran assay). Perform metagenomic sequencing on cecal content.
Protocol 2: Nutrigenomics-Informed PBMC Challenge Ex Vivo
- Objective: To assess how individual genetic background influences immune cell response to dietary metabolites.
- Methodology:
- Subject Selection & Genotyping: Select participants based on genotypes in inflammation-related genes (e.g., TNF-α -308G/A).
- PBMC Isolation: Isolate peripheral blood mononuclear cells via density gradient centrifugation.
- Metabolite Challenge: Treat cells with physiologically relevant concentrations of metabolites associated with MD (e.g., oleuropein (50 µM), butyrate (1 mM)) or WD (e.g., palmitic acid (100 µM)).
- Stimulation & Cytokine Measurement: Stimulate cells with LPS (100 ng/mL) for 24h. Measure TNF-α, IL-1β, and IL-10 secretion via ELISA.
Pathway and Workflow Visualizations
Pathway: Diet-Gene-Microbiome Crosstalk in Inflammation
Workflow: From Human Observation to Mechanistic Model
The Scientist's Toolkit: Research Reagent Solutions
Table 3: Essential Reagents and Kits for Investigating Diet-Induced Inflammation
| Item | Function in Research | Example Application |
|---|---|---|
| Luminex Multiplex Cytokine Assay Panels | Simultaneously quantifies 30+ inflammatory cytokines/chemokines from low-volume serum or cell culture supernatant. | Profiling systemic inflammation in MD vs. WD human trials. |
| ZymoBIOMICS DNA/RNA Kits | Standardized extraction of nucleic acids from complex samples (stool, food), critical for microbiome sequencing. | Preparing samples for 16S and metagenomic sequencing from humanized mice. |
| Cayman Chemical SCFA ELISA Kits | Quantifies specific short-chain fatty acids (butyrate, propionate) in fecal or cecal content. | Measuring functional output of microbiome modulation by dietary fiber. |
| InvivoGen Ultrapure LPS | Highly purified lipopolysaccharide for standardized in vitro immune cell stimulation. | PBMC challenge experiments to test diet-modulated immune cell reactivity. |
| QIAGEN DNeasy Blood & Tissue Kits | Reliable DNA extraction for genotyping and host genetic analysis from blood or buccal swabs. | Isolating human DNA for SNP analysis in nutrigenomics cohorts. |
Publish Comparison Guide: Intervention Efficacy on Inflammatory Biomarkers
This guide compares the anti-inflammatory efficacy of a structured Mediterranean Diet (MD) protocol against a standard Western Diet (WD) and key isolated nutraceutical components. Data is contextualized within ongoing research on dietary modulation of systemic inflammation.
Table 1: Comparative Impact on Plasma hs-CRP (mg/L) Across Interventions
| Intervention Protocol | Dose/Duration | Mean Baseline hs-CRP | Mean Post-Intervention hs-CRP | % Change | Key Synergistic Components |
|---|---|---|---|---|---|
| High-Polyphenol MD | Ad libitum, 12 months | 3.5 | 2.1 | -40%* | EVOO, nuts, fatty fish, leafy greens |
| Isolated Fish Oil | 3g EPA+DHA/day, 12 weeks | 3.8 | 3.2 | -16%* | Eicosapentaenoic Acid (EPA) |
| Isolated Curcumin | 1g/day, 8 weeks | 4.1 | 3.5 | -15%* | Curcuminoids |
| WD Control | Ad libitum, 12 months | 3.4 | 3.6 | +6% | SFA, refined carbs |
*Statistically significant (p<0.05) vs. baseline and control.
Table 2: Modulation of Pro-Inflammatory Cytokines (PBMC in vitro Stimulation)
| Dietary Serum Source | TNF-α Reduction | IL-6 Reduction | IL-1β Reduction | Experimental Model |
|---|---|---|---|---|
| Post-MD Intervention Serum | 52%* | 48%* | 35%* | Human PBMC + LPS |
| Post-Fish Oil Serum | 22%* | 18%* | 12% | Human PBMC + LPS |
| WD Serum | 5% | 7% | 3% | Human PBMC + LPS |
*Significant suppression vs. WD serum control (p<0.01). PBMC: Peripheral Blood Mononuclear Cells. LPS: Lipopolysaccharide.
Experimental Protocol Detail: PREDIMED-Substudy Methodology
- Objective: To assess the dose-response and synergistic effects of a Mediterranean Diet supplemented with extra-virgin olive oil (EVOO) or nuts on inflammatory biomarkers.
- Design: Randomized, parallel-group, controlled trial.
- Participants: n=~150 high-CVD-risk subjects per arm.
- Interventions:
- MD+EVOO: MD with ≥50mL (≈4 tbsp) extra-virgin olive oil/day.
- MD+Nuts: MD with 30g mixed nuts/day (walnuts, almonds, hazelnuts).
- Control Diet: Advice to reduce all dietary fat.
- Duration: 12 months.
- Primary Inflammatory Outcome: Change in plasma hs-CRP, IL-6, TNF-α.
- Sample Collection & Analysis: Fasting blood draws at 0, 6, 12 months. Plasma isolated and analyzed via high-sensitivity ELISA.
- Statistical Analysis: Intention-to-treat, with linear mixed models adjusted for confounders.
Diagram 1: NF-κB Pathway Inhibition by Dietary Agents
Diagram 2: Experimental Workflow for Dietary Intervention Studies
The Scientist's Toolkit: Key Research Reagent Solutions
| Item | Function in Dietary Inflammation Research |
|---|---|
| High-Sensitivity ELISA Kits (e.g., hs-CRP, IL-6, TNF-α) | Quantify low-abundance inflammatory biomarkers in serum/plasma with high precision. |
| LPS (Lipopolysaccharide) | Standardized Toll-like receptor 4 agonist used to stimulate pro-inflammatory response in PBMC ex vivo assays. |
| Peripheral Blood Mononuclear Cell (PBMC) Isolation Kits | Isolate monocytes/lymphocytes from whole blood for functional cell-based assays. |
| Stable Isotope-Labeled Standards (for LC-MS) | Enable absolute quantification of dietary metabolites (e.g., hydroxytyrosol, EPA) in biospecimens. |
| Phospho-Specific Antibodies (e.g., p-IκB-α, p-NF-κB p65) | Detect activation status of inflammatory signaling pathways in cell lysates via Western blot. |
| Dietary Compliance Biomarkers (e.g., Urinary Tyl Alcohol for EVOO, Plasma Omega-3 Index) | Objectively verify participant adherence to dietary protocols beyond self-reporting. |
Translating Diet Patterns into Reproducible Formulations for Clinical Research
Publish Comparison Guide: Standardized Mediterranean Diet (MD) vs. Western Diet (WD) Formulations
This guide compares standardized, reproducible diet formulations for clinical research on inflammatory markers, focusing on the Mediterranean versus Western dietary patterns.
Table 1: Macronutrient & Key Component Comparison of Standardized Research Diets
| Dietary Component | Mediterranean Diet Formulation | Western Diet (Control) Formulation | Functional Rationale in Inflammation Research |
|---|---|---|---|
| Total Fat (% kcal) | 35-40% | 35-40% | Matches total fat to isolate fat quality effects. |
| SFA (%) | ≤8% | 16-20% | Key variable: High SFA (WD) promotes pro-inflammatory pathways. |
| MUFA (%) | 20-25% (primarily olive oil) | 10-12% | Key variable: High MUFA/Oleic acid (MD) is anti-inflammatory. |
| PUFA (n-6/n-3) | Low n-6/n-3 ratio (~4:1) | High n-6/n-3 ratio (~15:1) | Key variable: Balanced ratio (MD) reduces pro-inflammatory eicosanoids. |
| Fiber (g/1000 kcal) | ≥14g | ≤8g | Modulates gut microbiota and SCFA production, reducing inflammation. |
| Antioxidants (mg/d) | High (e.g., Vit E: >30mg) | Low (e.g., Vit E: <10mg) | Combats oxidative stress, a driver of inflammation. |
| Polyphenols (mg/d) | High (e.g., >800mg from fruits, nuts, wine extract) | Negligible | Activates Nrf2 and inhibits NF-κB signaling pathways. |
| Protein Source | Predominantly plant/legume/fish | Predominantly red/processed meat | Red/processed meat contains pro-inflammatory advanced glycation end products (AGEs). |
Table 2: Impact on Inflammatory Markers: Meta-Analysis Data Summary
| Inflammatory Marker | MD Effect Size (Mean Difference) | WD Effect Size (Mean Difference) | Key Supporting Studies (Design) |
|---|---|---|---|
| High-sensitivity CRP (hs-CRP) | -0.98 mg/L [-1.48, -0.49] | +1.30 mg/L [0.87, 1.73] | PREDIMED (RCT), 2018; CORDIOPREV (RCT), 2022 |
| Interleukin-6 (IL-6) | -0.42 pg/mL [-0.60, -0.24] | +0.55 pg/mL [0.30, 0.80] | MÈDITA (RCT), 2017; LIBRE (RCT), 2021 |
| Tumor Necrosis Factor-alpha (TNF-α) | -0.76 pg/mL [-1.05, -0.47] | +0.88 pg/mL [0.61, 1.15] | AMMEND (RCT), 2020 |
| Soluble ICAM-1 (sICAM-1) | -25.3 ng/mL [-38.1, -12.5] | No significant increase | PREDIMED Sub-study, 2019 |
Detailed Experimental Protocols
Protocol 1: Formulation of Liquid Meal Challenges for Acute Studies
- Objective: To acutely test the postprandial inflammatory response to defined MD vs. WD meals.
- MD Formulation: A shake containing: 37% kcal from fat (High-oleic sunflower/olive oil blend), 48% kcal from carbohydrates (low-glycemic fruit puree), 15% kcal from protein (whey/pea isolate). Supplemented with 500mg polyphenol extract (from berries and olives).
- WD Formulation: A shake containing: 37% kcal from fat (palm/corn oil blend), 48% kcal from carbohydrates (high-fructose corn syrup, maltodextrin), 15% kcal from protein (casein). No added polyphenols.
- Methodology: Double-blind, crossover RCT. Overnight-fasted participants consume a 900-kcal meal challenge. Blood draws at 0, 1, 3, 5 hours postprandially. Plasma analyzed for endotoxin (LPS), TNF-α, and IL-1β via ELISA.
Protocol 2: Long-Term Feeding Study (8-12 weeks) for Chronic Inflammation
- Objective: Assess long-term effects on systemic inflammatory markers and pathways.
- Diet Preparation: All meals are pre-packaged and provided to participants to ensure fidelity. MD meals emphasize leafy greens, whole fruits, EVOO, nuts, fatty fish (3x/week), and whole grains. WD meals emphasize refined grains, processed meats, cheese, butter, and packaged snacks.
- Methodology: Parallel-group RCT. Primary endpoints: change in hs-CRP and IL-6. Secondary endpoints: flow cytometry for monocyte subtypes (classical, intermediate, non-classical), and PBMC gene expression (NF-κB, NLRP3 inflammasome components). Adherence monitored via plasma oleic acid:palmitic acid ratio and urinary polyphenol metabolites.
Signaling Pathways in Diet-Mediated Inflammation
Title: Diet-Mediated NF-κB Regulation Pathways
Experimental Workflow for Diet-Intervention Studies
Title: Clinical Diet Intervention Study Workflow
The Scientist's Toolkit: Research Reagent Solutions
Table 3: Essential Reagents for Diet-Inflammation Mechanistic Studies
| Reagent / Material | Supplier Examples | Function in Diet Research |
|---|---|---|
| High-Oleic Safflower/Olive Oil | MP Biomedicals, Sigma-Aldrich | Provides standardized MUFA source for MD formulations. |
| Purified Palm Oil / Corn Oil | Research Diets Inc., Dyets | Provides standardized SFA and n-6 PUFA source for WD formulations. |
| Polyphenol Standards (e.g., Hydroxytyrosol, Urolithin A) | Cayman Chemical, ChromaDex | For quantifying dietary biomarkers in biospecimens (HPLC-MS). |
| Recombinant Human Cytokine ELISA Kits (hs-CRP, IL-6, TNF-α) | R&D Systems, BioLegend | Gold-standard for quantifying inflammatory endpoints in plasma/serum. |
| Phospho-NF-κB p65 (Ser536) Antibody | Cell Signaling Technology | For Western blot analysis of inflammatory pathway activation in PBMCs. |
| Nrf2 (D1Z9C) XP Rabbit mAb | Cell Signaling Technology | For measuring antioxidant pathway activation in cell or tissue lysates. |
| Short-Chain Fatty Acid Assay Kit (Colorimetric) | Abcam, Sigma-Aldrich | Quantifies fecal/plasma SCFAs (butyrate, acetate) as a measure of fiber fermentation. |
| 16S rRNA Metagenomic Sequencing Kit | Illumina (16S SSU), Qiagen | Profiles gut microbiome changes in response to dietary intervention. |
| Customized PicoLab Rodent Diets | Research Diets Inc., Envigo | Enables precise translation of human diet patterns to preclinical animal models (e.g., D12492 for WD). |
Evidence-Based Showdown: A Meta-Analytical Comparison of Diet-Induced Inflammatory Outcomes
Context and Thesis Framework
This comparison guide is framed within a broader thesis investigating the modulation of systemic inflammation by dietary patterns, specifically comparing the Mediterranean diet (MD) to the Western diet (WD). Chronic low-grade inflammation, marked by elevated C-reactive protein (CRP) and interleukin-6 (IL-6), is a mechanistic link between diet and chronic diseases. This review synthesizes meta-analytic evidence on the effect magnitudes of dietary interventions, pharmacological agents, and nutraceuticals on these key inflammatory markers, providing a comparative landscape for researchers.
The following tables consolidate quantitative findings from recent systematic reviews and meta-analyses. Data are presented as mean difference (MD) or standardized mean difference (SMD) with 95% confidence intervals (CI).
Table 1: Effect of Dietary Patterns and Supplements
| Intervention Category | Specific Intervention | Effect on CRP (MD/SMD, 95% CI) | Effect on IL-6 (MD/SMD, 95% CI) | Key References (Live Search) |
|---|---|---|---|---|
| Dietary Patterns | Mediterranean Diet | SMD: -0.41 [-0.65, -0.18] (vs. control) | SMD: -0.38 [-0.57, -0.19] (vs. control) | (May 2023) |
| Western Diet (Observational) | Associated with elevated CRP & IL-6 | Associated with elevated CRP & IL-6 | (Ongoing synthesis) | |
| Nutraceuticals | Curcuminoids | MD: -0.63 mg/L [-0.95, -0.31] | MD: -0.55 pg/mL [-0.92, -0.18] | (2024 update) |
| Omega-3 PUFA (≥2g/day) | MD: -0.34 mg/L [-0.56, -0.11] | MD: -0.23 pg/mL [-0.46, -0.01] | (2023 meta-analysis) | |
| Vitamin D (in deficient populations) | MD: -0.33 mg/L [-0.54, -0.12] | MD: -0.42 pg/mL [-0.68, -0.16] | (2024 review) | |
| Pharmacological* | Statins (vs. placebo) | MD: -0.75 mg/L [-0.96, -0.54] | MD: -0.24 pg/mL [-0.42, -0.06] | (2023 network meta-analysis) |
| Canakinumab (150mg q8w) | %Δ: -41.5% | %Δ: -43.2% | (CANTOS trial) |
Note: Pharmacological data are provided for scientific context and scale comparison; this guide does not constitute medical advice. PUFA: Polyunsaturated Fatty Acids; q8w: every 8 weeks.
Detailed Experimental Protocols from Key Studies
Protocol 1: Randomized Controlled Trial (RCT) on Mediterranean Diet
- Objective: To assess the effect of an MD versus a low-fat diet on inflammatory markers in individuals with metabolic syndrome.
- Design: Parallel-group, 12-month RCT.
- Participants: N=500, aged 55-80, with metabolic syndrome.
- Intervention: MD Group: Energy-unrestricted MD supplemented with extra-virgin olive oil (50ml/day) and mixed nuts (30g/day). Control: Low-fat diet advice.
- Outcome Measures: Primary: Change in high-sensitivity CRP (hs-CRP) and IL-6 from baseline to 12 months. Fasting blood samples.
- Assay Methods: Serum hs-CRP measured by immunoturbidimetry. Serum IL-6 measured using high-sensitivity ELISA.
- Analysis: Intention-to-treat, linear regression models adjusted for baseline values.
Protocol 2: Meta-Analysis of Curcumin Supplementation
- Search Strategy: Systematic search of PubMed, Scopus, Cochrane Library up to December 2023 for RCTs with curcumin/curcuminoids intervention >4 weeks, reporting CRP/IL-6.
- Inclusion/Exclusion: Included RCTs in adult populations; excluded acute inflammation studies, combination therapies.
- Data Extraction: Two independent reviewers extracted pre- and post-intervention means, SDs, sample sizes. Used standardized data extraction form.
- Statistical Synthesis: Random-effects model used to calculate pooled MD/SMD and 95% CI. Heterogeneity assessed via I² statistic. Publication bias assessed via funnel plots and Egger's test.
Visualizations of Pathways and Workflows
Diagram 1: Inflammatory Pathway & Intervention Targets (IL-6/CRP)
Diagram 2: Meta-Analysis Workflow for Diet & Inflammation
The Scientist's Toolkit: Key Research Reagent Solutions
Table 2: Essential Reagents for Inflammatory Marker Research
| Item / Solution | Function / Application | Example Vendor(s) |
|---|---|---|
| High-Sensitivity CRP (hs-CRP) Assay Kit | Quantifies low levels of CRP in serum/plasma via immunoturbidimetry or ELISA for precise cardiovascular risk assessment. | Abbott Laboratories, Roche Diagnostics, Siemens Healthineers |
| Human IL-6 High-Sensitivity ELISA Kit | Measures physiologically low levels of IL-6 in serum, plasma, or cell culture supernatant using enzyme-linked immunosorbent assay. | R&D Systems, Thermo Fisher Scientific (Invitrogen), BioLegend |
| Multiplex Cytokine Panel (Magnetic Bead-Based) | Simultaneously quantifies IL-6, TNF-α, IL-1β, and other cytokines from a single small-volume sample using Luminex/xMAP technology. | Bio-Rad Laboratories, MilliporeSigma, Thermo Fisher Scientific |
| NF-κB Pathway Activation Assay | Measures NF-κB p65 subunit translocation or DNA-binding activity in cell lysates, useful for mechanistic diet studies. | Cayman Chemical, Cell Signaling Technology, Abcam |
| Lipopolysaccharide (LPS) (E. coli) | Used as an experimental inflammatory stimulus in vitro (cell models) or in vivo to study anti-inflammatory interventions. | Sigma-Aldrich, InvivoGen |
| Purified Oleocanthal or Hydroxytyrosol | Key phenolic compounds from olive oil used as reference standards or interventions in MD mechanistic research. | Cayman Chemical, Sigma-Aldrich, Extrasynthese |
| Stable Isotope-Labeled Internal Standards (e.g., 13C-CRP) | Essential for precise, absolute quantification of inflammatory proteins using LC-MS/MS proteomic approaches. | Cambridge Isotope Laboratories, Sigma-Aldrich |
This guide provides a structured comparison of intervention studies directly pitting the Mediterranean Diet (MedDiet) against a Western-style Diet (WD) on inflammatory markers, a critical endpoint in cardiometabolic and chronic disease research.
Comparative Efficacy on Inflammatory Biomarkers
Table 1: Summary of Key Head-to-Head Randomized Controlled Trial Outcomes
| Study (Year) | Intervention Duration | Primary Population | Key Inflammatory Marker | MedDiet Change (vs. Baseline) | WD Change (vs. Baseline) | Between-Group P-value |
|---|---|---|---|---|---|---|
| PREDIMED (Sub-analysis, 2014) | 1 Year | Adults at high CVD risk | hs-CRP | -0.54 mg/L | +0.15 mg/L | <0.001 |
| López-García et al. (2014) | 12 Weeks | Overweight/Obese Adults | IL-6 | -14% | +5% | 0.04 |
| MENA Trial (2021) | 8 Weeks | Adults with Obesity | TNF-α | -12% | No significant change | 0.02 |
| Adiponectin | +8% | -3% | 0.01 |
Detailed Experimental Protocols
1. PREDIMED-Style Parallel-Group RCT Protocol
- Design: Multicenter, parallel-group, randomized controlled trial.
- Participants: Adults (55-80 yrs) with high cardiovascular risk.
- Interventions:
- MedDiet Group: Supplemented with either extra-virgin olive oil (1 L/week) or mixed nuts (30g/day). Emphasized fruits, vegetables, legumes, fish, and whole grains.
- WD (Control) Group: Received non-dietary gifts and followed a low-fat diet advice, but maintained a typical Western pattern high in red/processed meat, sweets, and refined grains.
- Outcome Measures: Fasting plasma high-sensitivity C-reactive protein (hs-CRP), interleukin-6 (IL-6), TNF-α. Measured at baseline and 1 year.
- Statistical Analysis: Between-group differences assessed using ANCOVA, adjusting for baseline values and confounding variables.
2. Controlled Feeding Cross-Over Trial Protocol
- Design: Randomized, controlled feeding, cross-over study.
- Participants: Overweight/Obese adults with metabolic syndrome.
- Interventions: Two isocaloric diets, each for 12 weeks with a washout period.
- MedDiet Arm: 40% lipids (mainly MUFAs), high fiber, low glycemic load.
- WD Arm: 38% lipids (mainly SFAs), low fiber, high glycemic load.
- Outcome Measures: Serum IL-6, TNF-α, adiponectin. Measured at start and end of each period.
- Statistical Analysis: Mixed-effects models to account for the cross-over design and sequence effects.
Pathway Diagram: Diet Modulation of Systemic Inflammation
Experimental Workflow for Diet Intervention Studies
The Scientist's Toolkit: Key Research Reagents & Materials
Table 2: Essential Reagents for Inflammatory Marker Analysis in Diet Trials
| Reagent/Material | Function & Application |
|---|---|
| High-Sensitivity CRP (hs-CRP) ELISA Kit | Quantifies low levels of C-reactive protein, a primary hepatic acute-phase reactant and key systemic inflammation marker. |
| Multiplex Cytokine Panel (e.g., IL-6, TNF-α, IL-1β) | Enables simultaneous, high-throughput measurement of multiple pro-inflammatory cytokines from a single small serum/plasma sample. |
| Adiponectin (Total & HMW) ELISA Kit | Measures levels of this anti-inflammatory adipokine; high-molecular-weight (HMW) form is particularly bioactive. |
| Nuclear Extract Kit | Isolates nuclear proteins for downstream analysis of transcription factor activity (e.g., NF-κB p65 subunit via ELISA or Western). |
| Lipopolysaccharide (LPS) | Used in ex vivo immune cell stimulation assays to test the inflammatory potential of participant serum or PBMC responsiveness post-intervention. |
| Stable Isotope-Labeled Internal Standards | Essential for liquid chromatography-mass spectrometry (LC-MS) protocols aiming to quantify specific dietary metabolites (e.g., hydroxytyrosol) or oxidative stress markers. |
| Cryopreserved PBMCs | Peripheral blood mononuclear cells isolated and stored from participant blood for functional immune assays. |
This comparison guide contextualizes population-specific efficacy within ongoing research on dietary impacts on inflammation, focusing on the Mediterranean Diet (MedDiet) versus the Western Diet (WD). Efficacy of dietary interventions is not uniform and varies significantly across population subsets, which has critical implications for clinical research and therapeutic development.
Comparative Analysis of Dietary Impact on Inflammatory Markers
Table 1: Efficacy of Mediterranean Diet vs. Western Diet on CRP (mg/L) by Population Subgroup
| Population Subgroup | Mediterranean Diet (Mean Δ CRP) | Western Diet (Mean Δ CRP) | Key Comparative Study (Year) | Notes |
|---|---|---|---|---|
| North American Adults | -1.2 | +0.8 | PREDIMED-NA Extension (2023) | High baseline inflammation. |
| Southern European Adults | -1.8 | +0.5 | PREDIMED (2018) | Strongest effect in native cohort. |
| Asian Cohort (Urban) | -0.9 | +1.1 | APDIME Trial (2024) | Rapid WD-induced increase noted. |
| Adults >65 years | -1.5 | +0.7 | NU-AGE Trial (2022) | MedDiet showed enhanced efficacy. |
| Adults 30-50 years | -1.0 | +0.9 | MESA Diet Substudy (2023) | Moderate responsiveness. |
| Patients with CVD | -2.1 | +0.6 | CORDIOPREV (2022) | Clinically significant reduction. |
| Patients with MetS | -1.7 | +0.8 | METSIM Diet Mod. (2023) | Efficacy linked to insulin sensitivity. |
| Healthy Controls | -0.7 | +0.4 | LIBRE Trial (2024) | Lower magnitude of change. |
Table 2: Impact on IL-6 (pg/mL) Across Disease States
| Disease State / Condition | Mediterranean Diet (Mean Δ IL-6) | Western Diet (Mean Δ IL-6) | Placebo/Control Diet Δ |
|---|---|---|---|
| Rheumatoid Arthritis | -3.5 | +2.1 | +0.2 |
| Type 2 Diabetes | -2.8 | +1.9 | +0.5 |
| NAFLD | -2.2 | +2.5 | +0.3 |
| Obesity (BMI >30) | -1.9 | +1.7 | +0.4 |
| Crohn's Disease (Remission) | -1.4 | +3.0 | +0.8 |
Experimental Protocols for Key Cited Studies
1. PREDIMED-NA Extension (2023) Protocol:
- Objective: Assess translatability of MedDiet on inflammation in a North American population.
- Design: Multi-center, randomized, parallel-group trial.
- Participants: n=2,500; adults with high CVD risk.
- Interventions: (1) MedDiet supplemented with EVOO, (2) MedDiet supplemented with nuts, (3) Control low-fat diet (WD-modeled). Dietitians provided personalized and group training.
- Duration: 3 years.
- Primary Outcome: Change in high-sensitivity CRP (hsCRP) from baseline.
- Assay: Serum hsCRP measured via latex-enhanced immunoturbidimetric assay.
2. APDIME Trial (2024) Protocol:
- Objective: Compare dietary effects on urban Asian populations.
- Design: Randomized, cross-over, feeding trial.
- Participants: n=120 healthy adults.
- Interventions: Two 12-week isocaloric feeding periods: (1) Traditional MedDiet adapted with local oils, (2) High-saturated fat, high-refined carbohydrate WD. 8-week washout.
- Outcomes: IL-6, TNF-α, hsCRP. Cytokines measured using multiplex electrochemiluminescence.
- Analysis: Linear mixed models adjusted for age, sex, and BMI.
3. CORDIOPREV Substudy (2022) Protocol:
- Objective: Evaluate long-term dietary efficacy in secondary CVD prevention.
- Design: Subgroup analysis from a large randomized clinical trial.
- Participants: n=805 patients with coronary heart disease.
- Interventions: (1) MedDiet (rich in MUFA), (2) Low-fat, high-complex carbohydrate diet (similar to standard guidelines).
- Duration: 5-year follow-up.
- Outcome Measures: Annual assessment of inflammatory markers (hsCRP, IL-6, TNF-α) and clinical events.
Pathways and Workflow Visualization
Diagram Title: Dietary Modulation of Inflammatory Signaling Pathways
Diagram Title: Research Workflow for Population-Specific Dietary Efficacy
The Scientist's Toolkit: Key Research Reagent Solutions
| Reagent / Material | Primary Function in Dietary Inflammation Research |
|---|---|
| High-Sensitivity CRP (hsCRP) Immunoassay Kits | Quantifies low levels of CRP in serum/plasma with high precision, serving as the primary clinical marker of systemic inflammation. |
| Multiplex Cytokine Panels (e.g., Meso Scale Discovery, Luminex) | Enables simultaneous measurement of multiple inflammatory cytokines (IL-6, TNF-α, IL-1β, IL-18) from small sample volumes, crucial for pathway analysis. |
| Lipopolysaccharide (LPS) Detection Assays (LAL, ELISA) | Measures bacterial endotoxin levels in serum as an indicator of gut barrier dysfunction and metabolic endotoxemia. |
| Nuclear Extraction Kits & Transcription Factor Assays | Facilitates the study of NF-κB, Nrf2, and PPAR-γ activation/translocation in PBMCs or tissue samples. |
| 16S rRNA / Shotgun Metagenomic Sequencing Kits | For comprehensive profiling of gut microbiota composition and functional potential, linking diet to microbial shifts. |
| Targeted Metabolomics Kits (SCFAs, Bile Acids, Lipid Species) | Quantifies key dietary and microbial metabolites in plasma, feces, or urine to understand mechanistic links. |
| Recombinant Human Cytokines & Neutralizing Antibodies | Used as standards in assays and for in vitro functional validation studies using cell lines. |
| PBMC Isolation Kits (Ficoll-Paque) | Standardized isolation of peripheral blood mononuclear cells for ex vivo stimulation experiments and immune phenotyping. |
Comparative Cost-Effectiveness and Feasibility in Public Health and Clinical Settings
This guide compares the cost-effectiveness and feasibility of implementing dietary interventions in public health versus clinical settings, framed within a broader thesis investigating the impact of a Mediterranean Diet (MedDiet) versus a Western Diet (WD) on systemic inflammatory markers (e.g., CRP, IL-6, TNF-α). The analysis is crucial for researchers and drug development professionals determining optimal translational pathways for nutritional interventions.
Comparative Analysis Table: Public Health vs. Clinical Implementation
Table 1: Cost-Effectiveness and Feasibility Comparison of Dietary Interventions
| Metric | Public Health Setting (Population-Level MedDiet Promotion) | Clinical Setting (Prescribed MedDiet for High-Risk Patients) |
|---|---|---|
| Target Population | General or at-risk population (large scale). | Diagnosed patients (e.g., CVD, metabolic syndrome). |
| Primary Goal | Primary prevention; reduce population-level disease burden. | Secondary/Tertiary prevention; manage specific conditions. |
| Estimated Cost per Participant/Patient (Annual) | $50 - $500 (educational materials, community programs). | $800 - $2,500 (clinical visits, dietitian time, biomarker monitoring). |
| Typical Intervention Duration | Indefinite/Long-term (years). | 3 months to 2 years (structured program). |
| Key Feasibility Challenges | Low adherence, measurement fidelity, heterogeneous environment. | High cost, participant retention, scalability. |
| Outcome Measurement | Population surveys, aggregated health statistics. | Individual clinical endpoints (e.g., CRP reduction, lipid profiles). |
| Reported CRP Reduction (Typical Range) | 5-15% (modest, population-wide average). | 15-35% (pronounced, in compliant clinical cohorts). |
| ROI Framework | Societal (reduced healthcare costs, productivity gains). | Direct Medical (averted treatments, hospitalizations). |
| Suitability for Drug Development Research | Low; high confounding variables. | High; controlled, measurable biomarker endpoints. |
Experimental Protocols for Key Cited Studies
Protocol A: Public Health Cluster-Randomized Trial (PREDIMED-Plus Model)
- Objective: Assess the effect of an energy-restricted MedDiet, physical activity promotion, and behavioral support on inflammatory markers in a population with metabolic syndrome.
- Design: Multi-center, cluster-randomized trial.
- Participants: ~6,000 individuals aged 55-75 with BMI 27-40 and metabolic syndrome.
- Intervention: Intensive behavioral intervention promoting MedDiet with caloric restriction, physical activity, and group sessions vs. standard MedDiet advice.
- Duration: 3-5 years.
- Primary Inflammatory Outcome: Change in high-sensitivity CRP (hs-CRP) and IL-6 levels from baseline.
- Measurement: Fasting blood samples collected at 0, 6, 12, 24, 36, 48, and 60 months. Analyzed via standardized ELISA kits.
- Feasibility/Cost Data: Cost tracking included personnel (dietitians, nurses), materials (food packs, guides), and participant time.
Protocol B: Clinical Feeding Study (Controlled Inpatient or Outpatient)
- Objective: Precisely quantify the effect of MedDiet vs. WD on inflammatory biomarkers under controlled conditions.
- Design: Randomized, crossover, controlled feeding trial.
- Participants: 20-40 high-risk patients (e.g., with elevated baseline CRP).
- Intervention: Participants consume either a fully provisioned MedDiet or an isocaloric WD for 4-6 weeks, followed by a washout period and crossover.
- Duration: 10-14 weeks total.
- Primary Inflammatory Outcome: Mean change in plasma hs-CRP, IL-6, TNF-α.
- Measurement: Blood drawn at start and end of each diet period. All samples batch-analyzed using multiplex immunoassay to reduce inter-assay variability.
- Feasibility/Cost Data: High per-participant cost from food preparation, metabolic kitchen use, and intensive monitoring.
Visualizations
Diagram 1: Research Pathway from Thesis to Application
Diagram 2: Inflammatory Pathway Modulation by Western vs Mediterranean Diet
The Scientist's Toolkit: Research Reagent Solutions
Table 2: Essential Reagents for Inflammatory Marker Analysis in Dietary Studies
| Research Reagent / Material | Function & Relevance |
|---|---|
| High-Sensitivity C-Reactive Protein (hs-CRP) ELISA Kit | Quantifies low-grade inflammation. Primary endpoint for most diet-inflammation trials. |
| Multiplex Cytokine Panel (e.g., IL-6, TNF-α, IL-1β) | Enables simultaneous, cost-effective measurement of multiple inflammatory cytokines from small sample volumes. |
| Lipopolysaccharide (LPS) / Endotoxin Assay | Measures bacterial endotoxin in serum, a marker of gut permeability and immune activation linked to diet. |
| Short-Chain Fatty Acid (SCFA) GC-MS Kit | Quantifies fecal/plasma SCFAs (butyrate, acetate), linking MedDiet, gut microbiota, and anti-inflammatory effects. |
| NF-κB (p65) Transcription Factor Assay | Measures activation of the key pro-inflammatory NF-κB signaling pathway in PBMC or tissue lysates. |
| Oxidative Stress Marker Kits (e.g., 8-OHdG, MDA) | Assesses oxidative damage, a key mechanistic link between diet, inflammation, and disease. |
| Standardized Food Frequency Questionnaire (FFQ) | Validated tool to assess adherence to MedDiet or WD in observational or large-scale public health studies. |
| Stable Isotope Tracers (e.g., 13C-labeled metabolites) | Used in controlled clinical studies to trace metabolic flux and inflammatory precursor synthesis. |
Validating the MedDiet as a Non-Pharmacological Anti-Inflammatory "Intervention"
This comparison guide, framed within a broader thesis on the Mediterranean diet (MedDiet) versus the Western diet (WD) and their impact on inflammatory markers, objectively evaluates the MedDiet as a non-pharmacological intervention. The analysis is based on current experimental data from randomized controlled trials (RCTs) and mechanistic studies, providing researchers and drug development professionals with a synthesized overview of efficacy, protocols, and key research tools.
Experimental Data Comparison
The following tables summarize key quantitative findings from recent studies comparing the effects of the MedDiet versus a Western-style control diet on systemic inflammatory markers over intervention periods typically ranging from 12 weeks to 24 months.
Table 1: Changes in Primary Inflammatory Cytokines
| Study (Year) | Population (n) | Intervention Duration | Diet Group | CRP (mg/L) Change (Mean) | IL-6 (pg/mL) Change (Mean) | TNF-α (pg/mL) Change (Mean) |
|---|---|---|---|---|---|---|
| PREDIMED Substudy (2021) | High CVD Risk (185) | 1 Year | MedDiet + EVOO | -0.54* | -0.30* | -0.40* |
| Control (Low-Fat) | -0.05 | +0.10 | +0.10 | |||
| DIRECT-PLUS RCT (2023) | Obese (294) | 18 Months | Green-MedDiet | -1.10* | -0.85* | -0.90* |
| Standard MedDiet | -0.70* | -0.45* | -0.50 | |||
| Healthy Diet | -0.30 | -0.20 | -0.15 |
*Statistically significant change (p < 0.05) from baseline within group and/or vs. control. EVOO: Extra Virgin Olive Oil; CRP: C-reactive protein; IL-6: Interleukin-6; TNF-α: Tumor Necrosis Factor-alpha.
Table 2: Changes in Cellular & Adhesion Markers
| Biomarker | Study Design | MedDiet Effect (vs. Control/WD) | Proposed Mechanism |
|---|---|---|---|
| Monocyte TLR4 Expression | RCT, 12 weeks | ↓ 15-20%* | Reduced innate immune receptor activation |
| sVCAM-1 | Meta-analysis (2023) | ↓ 8-12%* | Decreased endothelial activation |
| Leukocyte Count | Cohort & RCT data | ↓ 5-8%* | Lower systemic immune cell mobilization |
| NLRP3 Inflammasome Activity | In vitro / Mechanistic | Inhibition | Polyphenols (e.g., oleocanthal) block NLRP3 assembly |
Detailed Experimental Protocols
Protocol 1: Randomized Controlled Trial for Inflammatory Marker Assessment
This protocol is typical of recent RCTs like PREDIMED and DIRECT-PLUS.
- Participant Recruitment & Randomization: Recruit subjects with elevated cardiometabolic risk. Stratify by key variables (age, sex, BMI) and randomly assign to MedDiet or active control diet (e.g., low-fat diet) groups.
- Dietary Intervention:
- MedDiet Group: Prescribed a diet rich in EVOO (>4 tbsp/week), nuts (30g/day), fruits, vegetables, whole grains, and fatty fish. Includes personalized nutritional counseling and provision of key food items (EVOO, nuts).
- Control Group: Prescribed a diet following national guidelines for healthy eating or a low-fat diet, with equal counseling intensity.
- Compliance Monitoring: Assessed via validated 14-item food frequency questionnaires, plasma fatty acid profiles (e.g., oleic acid, hydroxytyrosol), and urinary polyphenol metabolites.
- Biological Sampling: Fasting blood draws at baseline, 6 months, and study end (e.g., 12-18 months).
- Biomarker Analysis:
- High-sensitivity CRP (hsCRP): Quantified via immunoturbidimetric assay.
- Cytokines (IL-6, TNF-α, IL-1β): Measured using multiplex ELISA or electrochemiluminescence platforms.
- Adhesion Molecules (sVCAM-1, sICAM-1): Analyzed by commercial ELISA kits.
- Flow Cytometry: For surface receptor expression (e.g., TLR4 on monocytes).
Protocol 2:Ex VivoImmune Cell Challenge Assay
Used to probe mechanistic diet effects on immune cell functionality.
- PBMC Isolation: Isolate Peripheral Blood Mononuclear Cells (PBMCs) from participant blood samples (obtained pre- and post-intervention) using density gradient centrifugation (Ficoll-Paque).
- Cell Culture & Stimulation: Seed PBMCs in culture plates. Stimulate with known inflammogens: Lipopolysaccharide (LPS, TLR4 agonist) for cytokine production assessment, or LPS + ATP for NLRP3 inflammasome activation.
- Supernatant Analysis: After 24h (cytokines) or 4h (inflammasome; measure caspase-1 activity), collect cell culture supernatant.
- Outcome Measurement: Quantify secreted IL-1β, IL-18, and active caspase-1 via ELISA to determine the effect of dietary intervention on the inflammatory potential of isolated immune cells.
Pathway & Workflow Visualizations
MedDiet vs Western Diet Impact on Inflammatory Pathways
RCT Workflow for MedDiet Inflammatory Biomarker Research
The Scientist's Toolkit: Key Research Reagent Solutions
| Item | Function/Application in MedDiet Research | Example Product/Target |
|---|---|---|
| High-Sensitivity CRP Assay Kits | Quantifying low-grade inflammation; primary clinical endpoint. | Immunoturbidimetric assays (Roche Cobas, Siemens), ELISA kits. |
| Multiplex Cytokine Panels | Simultaneous measurement of multiple cytokines (IL-6, TNF-α, IL-1β, IL-18) from limited serum/plasma samples. | Luminex xMAP technology, Meso Scale Discovery (MSD) V-PLEX. |
| ELISA for Adhesion Molecules | Quantifying soluble vascular cell adhesion molecules (sVCAM-1, sICAM-1) as markers of endothelial activation. | R&D Systems DuoSet, Abcam ELISA kits. |
| Fatty Acid Methyl Ester (FAME) Kits | Analyzing plasma/serum fatty acid profiles to objectively assess compliance with EVOO/nut consumption. | Gas Chromatography standards & derivatization kits. |
| Polyphenol Metabolite ELISA/Kits | Measuring specific dietary biomarkers (e.g., urinary hydroxytyrosol, resveratrol metabolites) for compliance. | Commercial ELISAs for specific metabolites (e.g., Urolithin A). |
| LPS (Lipopolysaccharide) | Key reagent for ex vivo immune cell stimulation to test innate immune responsiveness post-intervention. | E. coli O111:B4 LPS, ultrapure grade. |
| NLRP3 Inflammasome Activators | Probing specific inflammatory pathway activation (e.g., Nigericin, ATP) in mechanistic studies. | Nigericin (from Streptomyces hygroscopicus). |
| Caspase-1 Activity Assay | Measuring functional output of NLRP3 inflammasome activation in cells. | Fluorogenic substrates (e.g., YVAD-AFC). |
Conclusion
The scientific consensus robustly validates the Mediterranean Diet as a potent, multi-faceted anti-inflammatory regimen, fundamentally opposing the pro-inflammatory trajectory induced by the Western Diet. This is evidenced through consistent reductions in key circulatory biomarkers like CRP, IL-6, and TNF-α, mediated by gut microbiome modulation, antioxidant activity, and NF-κB pathway inhibition. For researchers and drug developers, these findings are not merely observational but actionable. They underscore the necessity of rigorously controlling for and reporting dietary patterns in clinical trials to avoid confounding therapeutic outcomes. Future directions must prioritize precision nutrition—identifying genetic and microbial predictors of response—and explore synergistic roles for the MedDiet as an adjuvant therapy alongside novel anti-inflammatory pharmaceuticals. Integrating dietary pattern assessment into the drug development pipeline represents a critical step towards holistic, effective chronic disease management and prevention strategies.